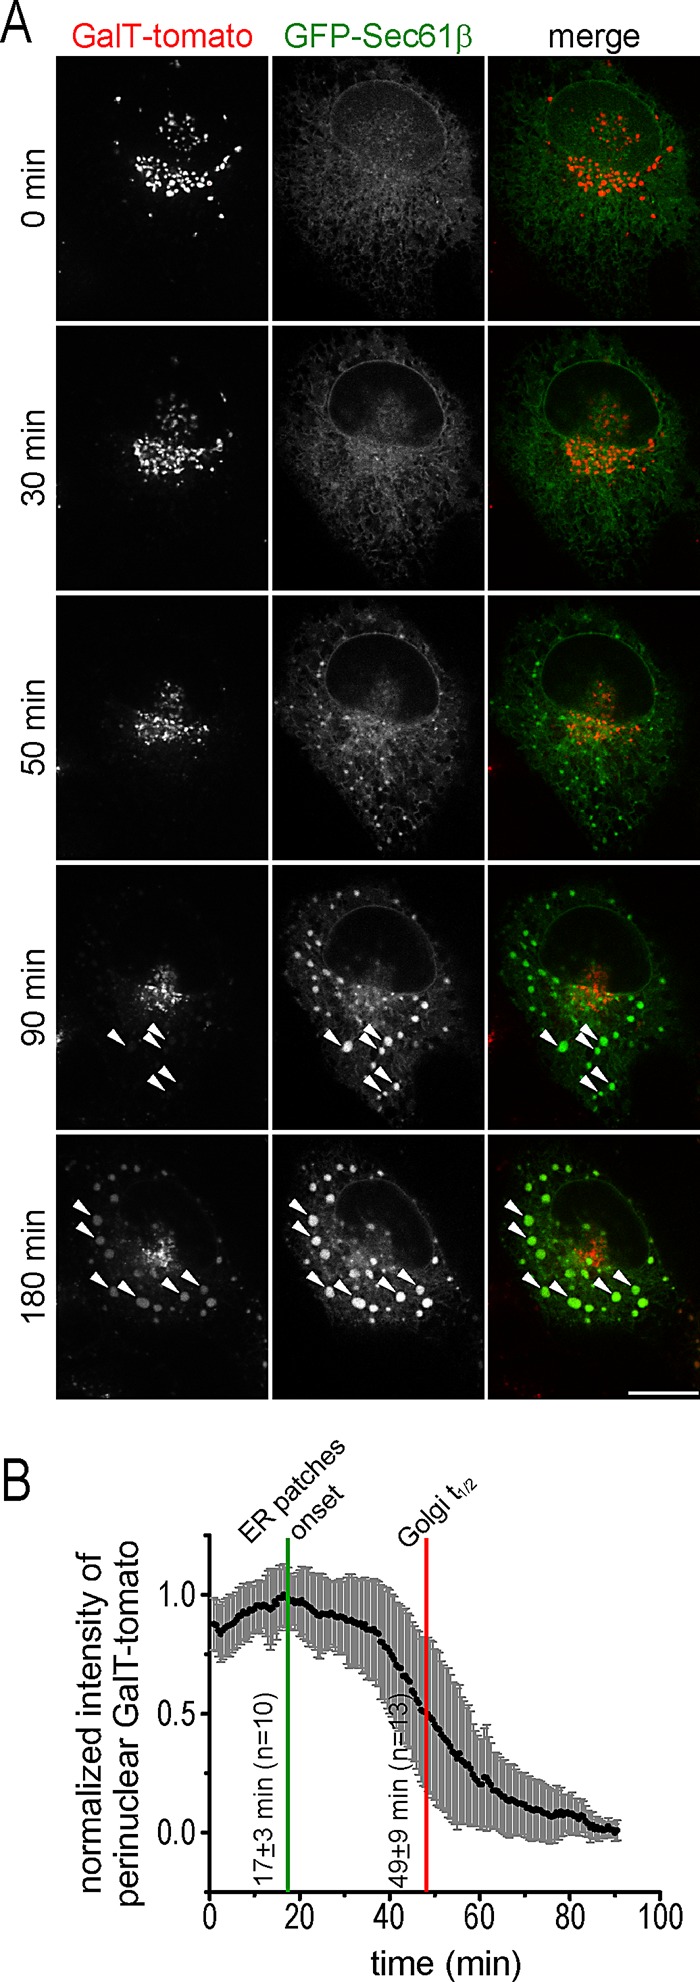
FIGURE 6:

Relocalization of the Golgi marker GalT-tomato to the ER induced by dispergo. (A) BSC1 cell transiently expressing GalT-tomato and GFP-Sec61β were treated with dispergo and imaged by spinning disk confocal microscopy (see Supplemental Movie S4). Arrowheads highlight colocalization of GalT-tomato and GFP-Sec61β at ER patches marked by GFP-Sec61β. Scale bar, 10 μm. (B) Time dependence for the loss of GalT-tomato from the perinuclear region corresponding to the Golgi apparatus induced by dispergo in BSC1 cells stably expressing GalT-tomato. The fluorescence intensity of GalT-tomato at the perinuclear region determined before dispergo addition was used to normalize the data. Plot shows mean values and SD for each time point (n = 13 cells). Golgi t1/2 represents the mean time ± SD that it took for the signal of GalT-tomato to be reduced by 50%. “ER patches onset” marks the time at which the appearance of ER patches labeled with GFP-Sec61β was first detected (n = 10 cells).
