
FIGURE 1:
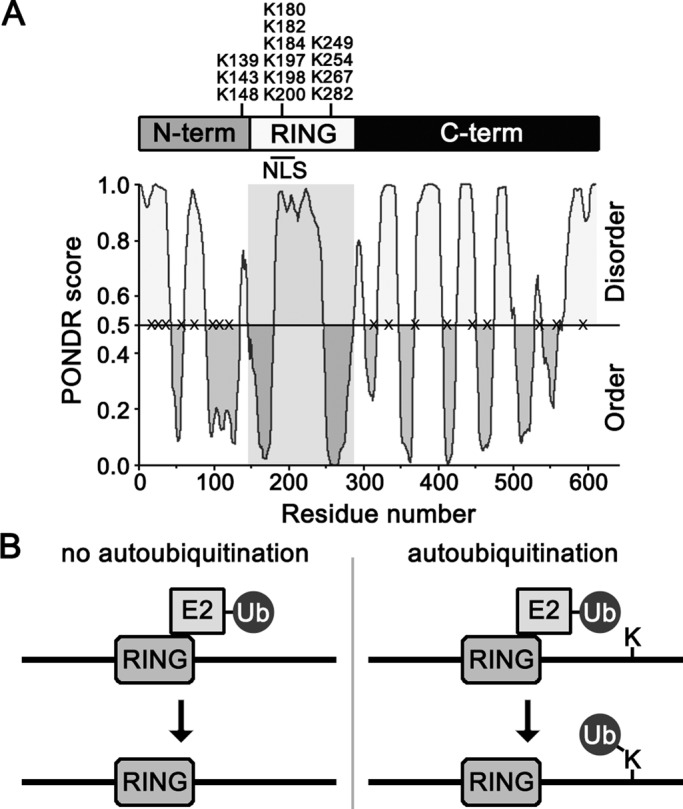
Sequence features of San1. (A) Representation of the overall domain topology of San1. Endogenous Lys residue positions are marked on top. A line denotes the presence of an NLS in the RING domain (Gardner et al., 2005). PONDR (www.pondr.com/) evaluation of San1’s intrinsic disorder is on the bottom. Gray box highlights the RING domain. The X's on the 0.5 line mark the location of the “plus Lys” mutants. (B) Model of in cis autoubiquitination upon addition of a Lys residue in the intrinsically disordered C-terminal region of San1.