FIGURE 1:
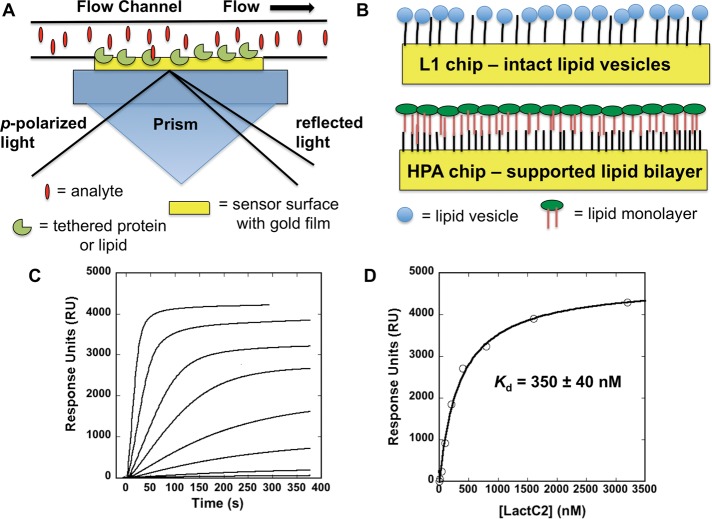
SPR system and lipid-coating setups, along with equilibrium binding analysis of the lactadherin C2 domain to a 1-palmitoyl-2-oleoylphosphatidylcholine (POPC):1-palmitoyl-2-oleoylphosphatidylserine (POPS; 70:30) vesicle surface. (A) A typical SPR setup is shown for one flow cell in a SPR instrument. The gold surface of a sensor surface can be modified chemically to allow attachment of a ligand, which could be a protein, a lipid, or another biomolecule of interest. The analyte is then injected and flowed over the ligand surface to detect binding of the analyte. Detection of binding to ligand on the gold sensor surface is possible as below the gold chip surface p-polarized light traveling through an optically dense prism reaches the interface between the prism and a medium of lower optical density and is reflected back and detected by an array of photodiodes or charge-coupled detectors. The specific angle of incidence of light produces a shadow or SPR because of energy transfer between the evanescent wave and plasmons on the surface of the gold chip. The evanescent wave propagates into the flow cell opposite the gold interface to ∼100 Å and is sensitive to the mass concentration on the surface. The mass change on the surface can be detected in a time-dependent manner as a change in angle that is reflected to the detectors and displayed on the instrument as change in signal, typically RU. (B) The two most common surfaces used for coating lipid vesicles are Biacore L1 and HPA chips. The L1 chip (top) allows for coating of intact lipid vesicles through insertion of alkane groups present on the carboxymethyldextran-coated gold surface. The HPA chip contains a hydrophobic alkanethiol surface, which promotes the docking of a lipid monolayer on the surface to form a supported bilayer. Either surface may be useful for SPR experiments, as outlined in the text. (C) A POPC:POPS surface coated on a L1 chip was used to test the binding of the lactadherin C2 domain with a Biacore X. A POPC surface was used as a control to correct for any refractive index changes upon injection of the protein at increasing concentrations. The C2 domain was injected at increasing concentrations (5, 10, 40, 100, 200, 400, 800, 1600, and 3200 nM) at a flow rate of 30 μl/min to determine the saturation response in signal (RU) at each respective protein concentration. (D) Saturation values determined from the RU at respective C2 domain concentrations (shown in C) were plotted and fit with a nonlinear least squares analysis using the equation Req = Rmax/(1 + Kd/C) to determine Kd as shown. Experiments were repeated in triplicate to determine the average Kd and SD for the lactadherin C2 domain (320 ± 90 nM) to POPC:POPS (70:30) vesicles.

