FIGURE 4:
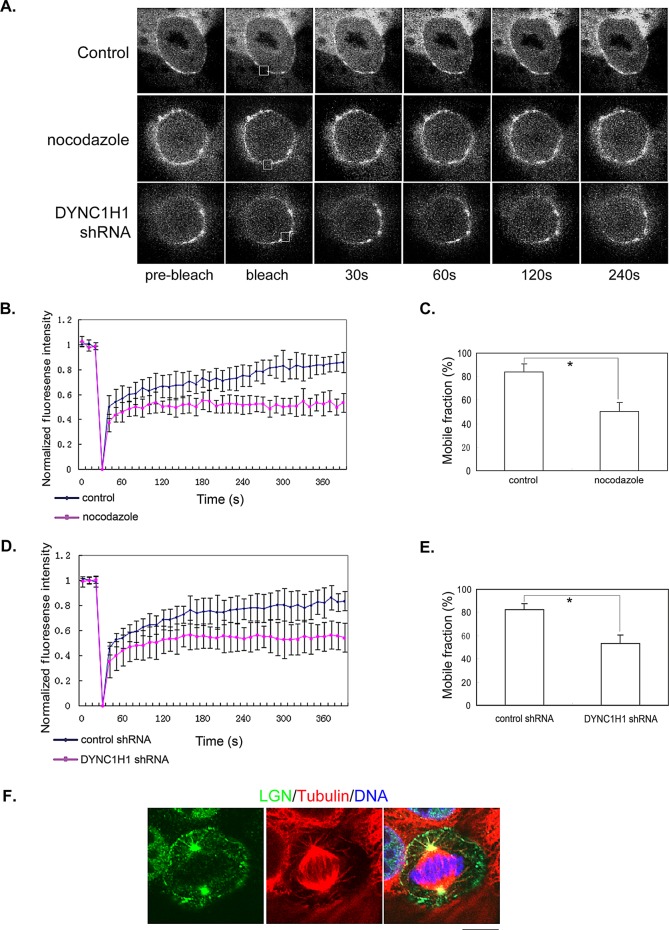
Dynamic turnover of cortical LGN relies on astral MTs and DYNC1H1. (A) FRAP analysis of cortical LGN. Representative images from live-cell time-lapse series were shown. The photobleaching areas were marked by squares. Stable MDCK cells expressing Venus-LGN were either untreated (top), treated with 50 nM nocodazole for 1 h (middle), or transfected with DYNC1H1 shRNA for 48 h (bottom) before being subjected to FRAP analysis. (B–E) Quantitative analysis of FRAP experiments. (B, D) Plots of normalized fluorescence intensity of cortical Venus-LGN in cells treated with DMSO (B, blue diamonds), 50 nM nocodazole (B, pink squares), or transfected with control shRNA (D, blue diamonds) or DYNC1H1 shRNA (D, pink squares) vs. time (in seconds) after photobleaching. Data are expressed as mean ±SEM (n = 8 for each set). (C, E) The mobile fractions of cortical Venus-LGN in control, nocodazole-treated, or DYNC1H1-knockdown cells were calculated from the fluorescence recovery curves shown in B and D. Data are expressed as mean ±SEM. *p < 0.01. (F) Association of Venus-LGN with astral MTs. MDCK cells expressing Venus-LGN were preextracted with microtubule stabilization buffer containing 0.2% Triton X-100 and then fixed with 4% PFA. Fixed cells were stained with anti-LGN (green), anti–α-tubulin (red) antibodies, and DNA dye (blue). Bar, 10 μm.

