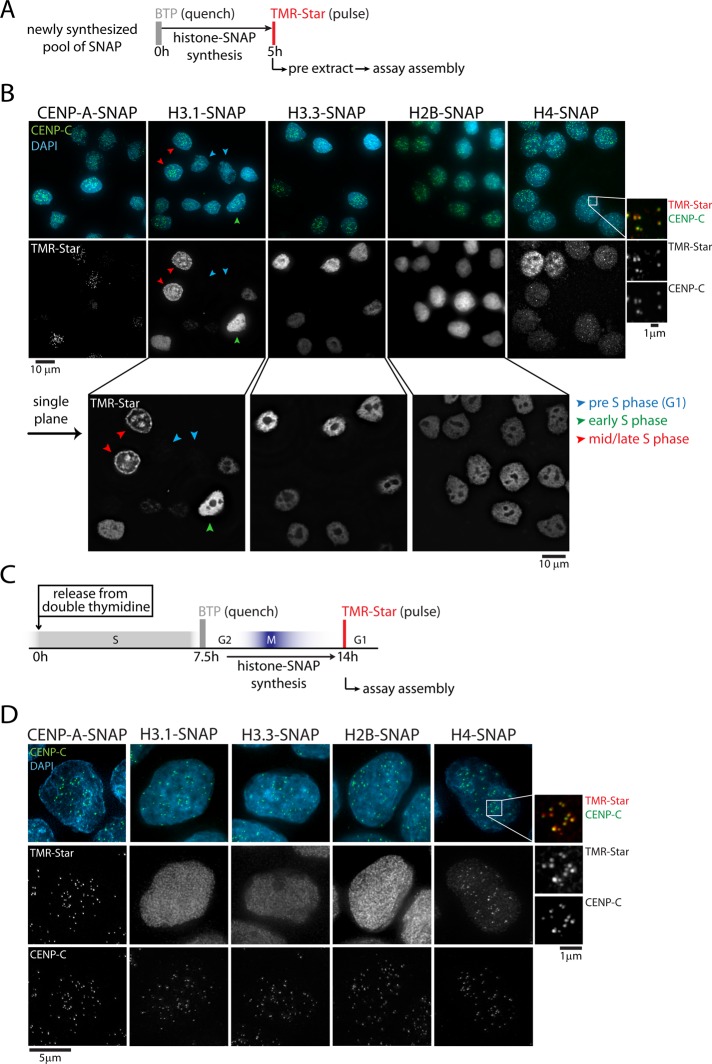
FIGURE 1:
H4, but not H3.1, H3.3, or H2B, is coassembled with CENP-A in G1 phase. (A) Outline of quench-chase-pulse labeling strategy, allowing visualization of a newly synthesized pool of SNAP, followed by Triton-based preextraction. (B) Results of A for indicated histone–SNAP fusion proteins. Enlargement to the right shows rescaled images to indicate colocalization of newly synthesized H4-SNAP with centromeres (marked by CENP-C). Enlargements below show single–focal plane images to indicate specific subnuclear assembly patterns. Blue, green, and red arrows show G1, early S, and mid/late S phase cells, respectively. (C) Outline of quench-chase-pulse experiment on synchronized cells. (D) Results of C for SNAP-tagged histone proteins. CENP-C staining indicates centromere positions. Enlargement shows colocalization of newly synthesized H4-SNAP with centromeres.

