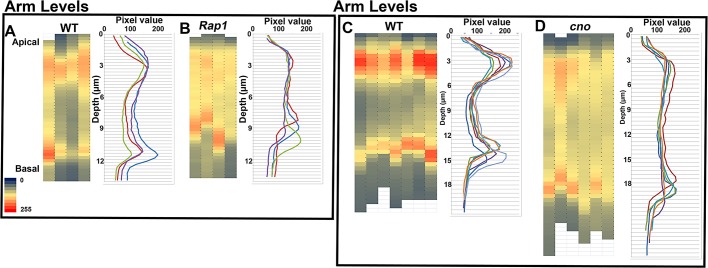
FIGURE 2:
Rap1 and Cno regulate apical positioning of Arm in forming apical junctions. The Plot Profile option in ImageJ was used to measure average image intensity in projected cross-sections, and data were displayed either as heat maps illustrating intensity with different colors (left, apical is on top; each column is a different embryo) or graphically, displaying pixel intensity vs. depth from the apical surface (right, each line is a different embryo). Note that since we use embryos from more than one experiment, these quantitative measures are useful for comparing signal intensity along the apical–basal axis within an embryo, but absolute intensities between embryos vary due to variations in staining and imaging.

