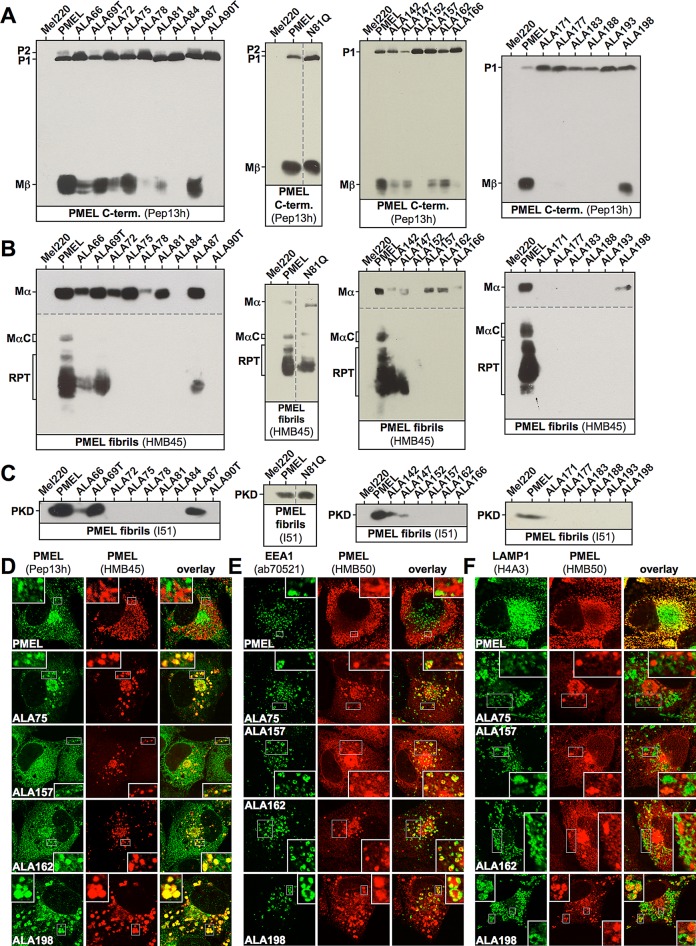
FIGURE 4:
Proteolytic maturation and subcellular distribution of PMEL NTR alanine-scanning mutants. (A–C) Western blot analysis of SDS-lysed total membranes using PMEL-specific antibodies Pep13h (A), HMB45 (B), and I51 (C). Vertical dashed lines indicate positions where irrelevant lanes have been removed from the image. Horizontal dashed lines separate different exposures of the same blot. (D–F) Selected cell lines from A–C were analyzed by IF using antibodies against newly synthesized (Pep13h) and mature (HMB45) PMEL (D), the early endosomal marker EEA1 (ab70521) and mature PMEL (HMB50; E), or the lysosomal marker LAMP1 (H4A3) and mature PMEL (HMB50; F). Note that the HMB45/HMB50-reactive population of the indicated alanine-scanning mutants but not of wt-PMEL colocalizes with the respective newly synthesized, Pep13h-reactive population (D) partially in endosomes with intense peripheral EEA1 decoration (E; see Supplemental Table S1). Only mature wt-PMEL distributes into the characteristic melanosomal horseshoe-shaped band wrapping around the perinuclear LAMP1high zone (F). The corresponding IF data for the other mutants in A–C are shown in Supplemental Figures S3 and S1, D and E.

