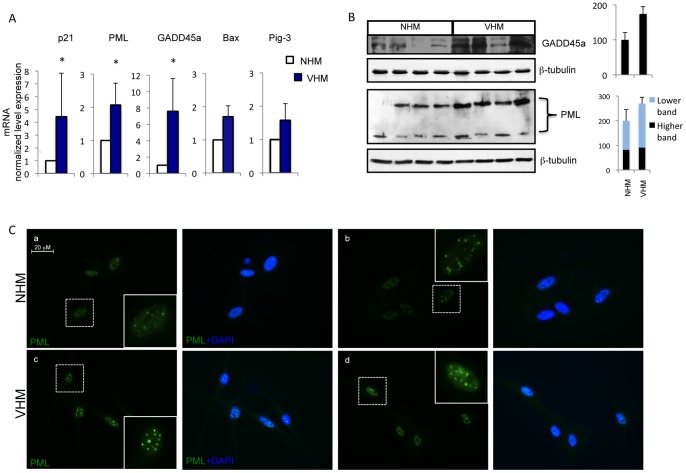
Figure 3. Analysis of p53 target genes expression.
(A) Quantitative RT-PCR analysis was performed for each sample in triplicate. The median ΔΔCt value, calculated as reported in Fig.1. Each patient sample (n = 11) was directly compared with all control samples (n = 15) and values represent the means ± SD of fold increase of p53 target genes. (B) The increased expression of GADD45a and PML were also confirmed at protein level by western blot and densitometric analysis (VHM = 9; NHM = 9). For PML two different isoforms were detected and quantified separately. (C) Representative analysis of intracellular distribution of PML by immunofluorescence analysis (VHM = 6; NHM = 6). Nuclei were labelled with bisbenzidine (DAPI). Original magnification 63x. *p≤0.05.

