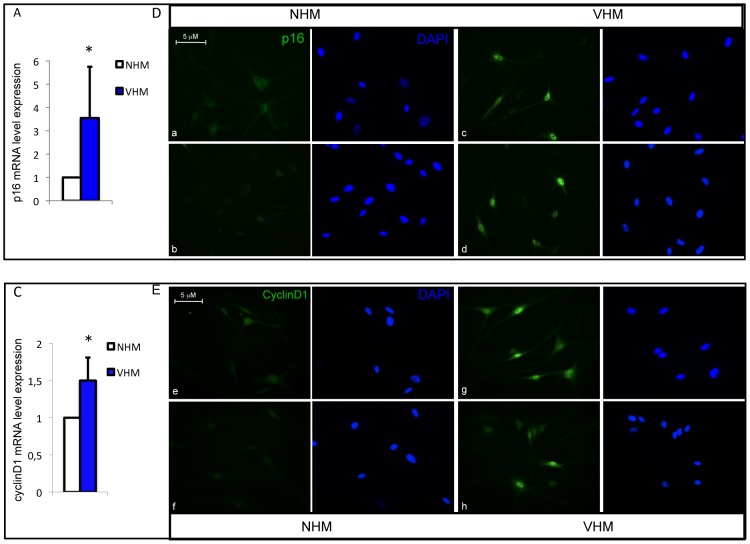
Figure 4. Analysis of cell cycle regulators expression.
(A) p16 and (B) CyclinD1 mRNAs (VHM = 11; NHM = 15). (C-D) Immunoflurescence analysis of p16 and cyclinD1 expression and localization. Representative images of VHM (right panel) and NHM (left panel) stained with mouse anti-p16 and anti-cyclinD primary antibodies. Nuclei were labelled with bisbenzidine (DAPI). Original magnification 40x. *p≤0.05.

