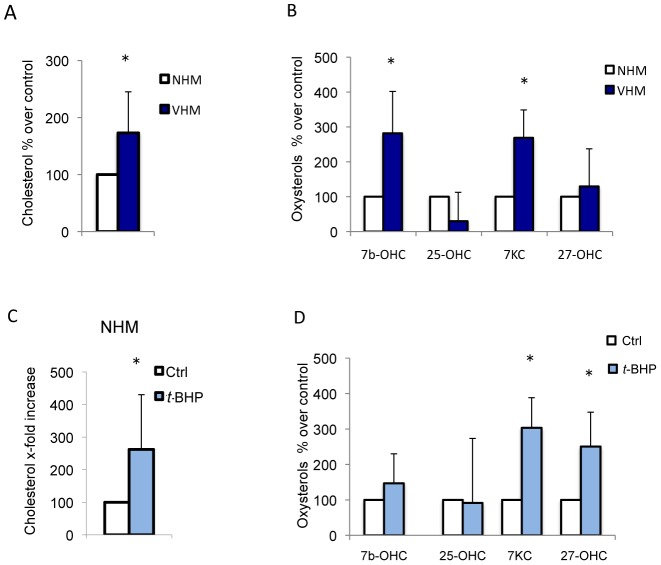
Figure 6. Cholesterol and oxysterols content in VHM and peroxide-treated NHM.
(A) The cholesterol and oxysterols (B) levels were measured by GC-MS analysis in VHM (n = 10) and NHM (n = 10). Histogram reports the average ± SD after normalization for protein concentration setting the NHM cholesterol content as 100. (C-D) The cholesterol and oxysterols levels of NHM treated with 100 µM t-BHP for 24 h. Results are expressed as percentage ± SD after setting the untreated cells cholesterol content as 100.

