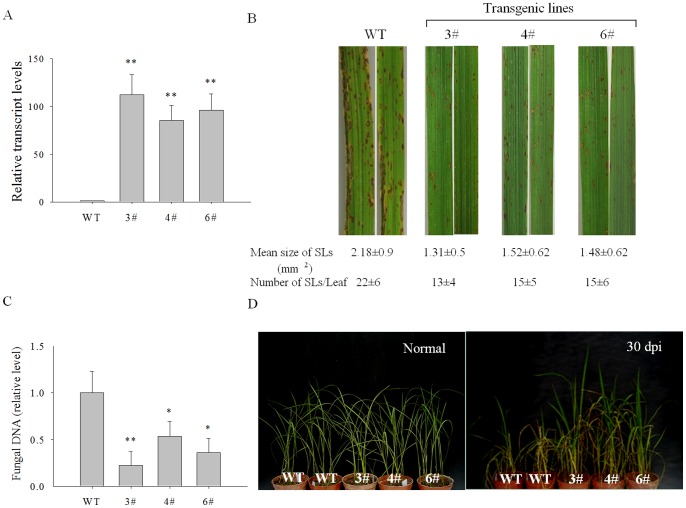
Figure 7. Analysis of resistance to blast fungus in OsPIANK1-overexpressing (OE) rice plants.
(A) Quantitative PCR analysis of OsPIANK1 expression in WT and OE plants (3#, 4#, and 6#). Data represent means ± SE of three independent experiments. (B) Lesions in leaves at 6 days after inoculation. The number of expanding lesions (Els) with an area greater than 0.5 mm2 per leaf and their mean areas were determined using 10 leaves for WT (Nipponbare) and OsPIANK1-OE plants. Values represent means ± SE. (C) The amount of M. oryzae DNA in the WT and OsPIANK1-OE rice leaves. The leaves were harvested at 6 days after inoculation. Values represent the mean ± SE of three independent experiments. (D) Symptoms of rice blast in OsPIANK1-OE and WT rice plants grown in the greenhouse at 30 days after inoculation with spores of M. oryzae strain guy11. (**,*indicate significant differences between WT and OsPIANK1-OE plants at P<0.01 or P<0.05, respectively, as determined by the SNK test.).

