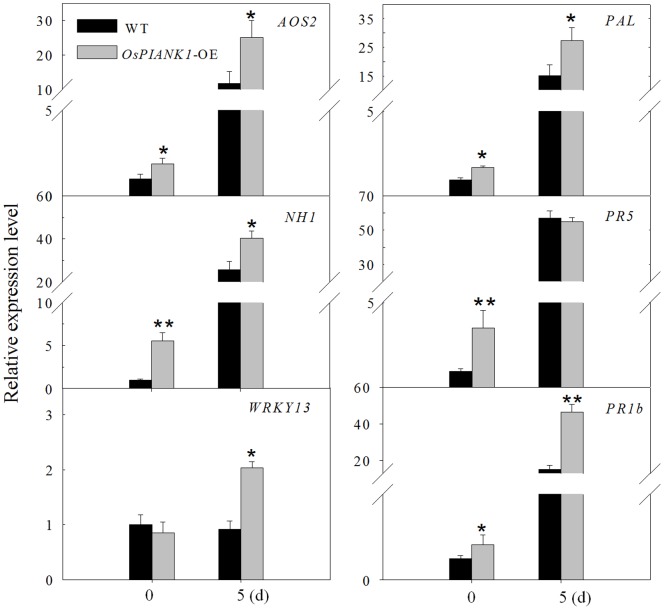
Figure 8. Overexpression of OsPIANK1 influenced the expression of a set of genes functioning in SA- and JA-associated pathways during disease resistance against M.oryzae strain guy11 analyzed by quantitative real time-PCR.
Bars represent mean ± SE of three biological replicates. (**, *indicate significant differences between the OsPIANK1-OE and wild-type plants at the same time at P<0.01 or P<0.05, respectively, as determined by the SNK test.).

