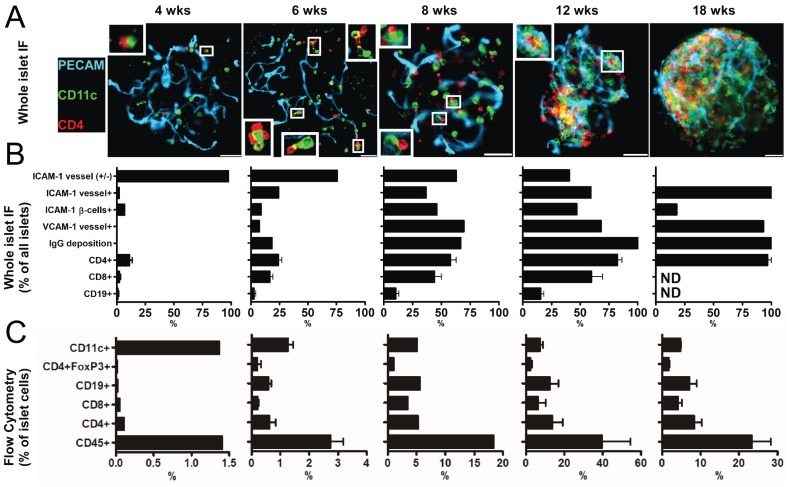
Figure 1. Examination of NOD islets throughout diabetogenesis.
(A) Islets of Langerhans were isolated from NOD mice at the indicated ages and stained for blood vessels (PECAM-1), intra islet myeloid cells (CD11c), and T cell (CD4). Shown are representative images obtained from a pool of 6 mice per age from two independent experiments. Insets show contacts between intraislet myeloid cells and T cells. White bars represent 50 µm. (B) Islets were isolated and stained for the indicated markers and then scored for presence or absence of staining. Bars represent mean+/−S.D. of the percentage of marker positive islets of Langerhans obtained from a pool of 6 mice per group from two independent experiments. (C) Islets of Langerhans were dispersed and cells were examined by flow cytometry for the indicated cell surface markers. Bars represent the mean+/−S.D. of the percentage of total islet cells identified in two independent experiments per age. Results were obtained from a pool of 8 to 10 mice per group.

