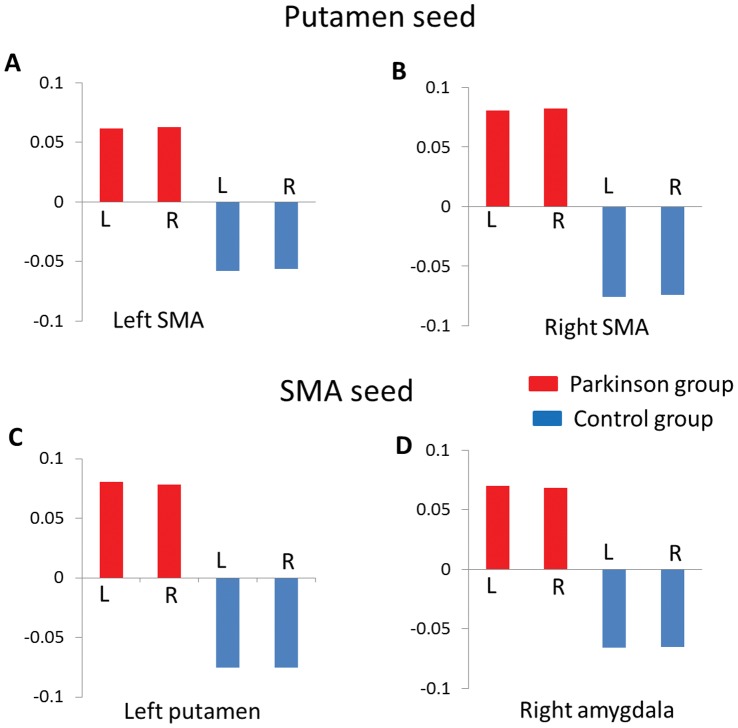
Figure 5. The beta values of functional connectivity in both groups.
The patients group showed positive putamen-SMA functional connectivity, whereas the control group exhibited negative putamen-SMA functional connectivity (A&B). The patients group showed positive SMA-putamen (C) and SMA-amygdala (D) functional connectivity, whereas the control group exhibited negative functional connectivities. L: left seed; R: right seed.

