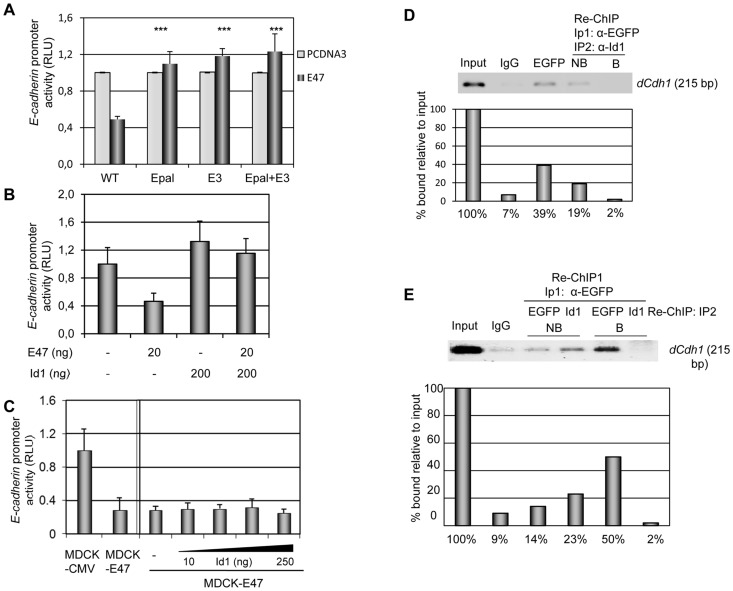
Figure 2. E47 represses E-cadherin by direct binding to the endogenous promoter in complexes devoid of Id1.
(A) Dependence of E47 repression of E-cadherin promoter on proximal E-boxes. HEK293T cells transiently co-transfected with 200 ng of the proximal wild type mouse E-cadherin-Luciferase promoter (−178/+92 bp) or point mutants in the proximal E-boxes (E-pal +/− E-box3) and 10 ng of CMV-beta-gal plasmid in the presence of 50 ng of pcDNA3-E47 (dark grey bars) or control pcDNA3 (light grey bars) vectors, as indicated. Differences between the E47 mediated repression of the mutants versus the wild type promoter were statistically analysed by t-Student test (***p<0.001). (B) and (C) E-cadherin promoter activity in MDCK (B) and MDCK-CMV and MDCK-E47 (C) cells transiently co-transfected with 200 ng of the proximal mouse E-cadherin-Luciferase promoter (−178/+92 bp) and 20 ng of TK-Renilla (B) or 10 ng of CMV-beta-gal (C) plasmids, in combination with the indicated amounts of pcDNA3-E47 and/or pcDNA3-Id1 vectors. RLU is normalized to that detected with empty pcDNA3 vector (A, B) or in control MDCK-CMV cells (C, left); results represent the mean of at least two independent experiments +/− s.d. (D) and (E) Chromatin immunoprecipitation (ChIP) assays of EGFP-E47 at the endogenous E-cadherin promoter in MDCK-EGFP-E47 cells. (D) ChIP assays were first performed with an antibody specific for EGFP or control IgG and the bound fraction analysed for endogenous E-cadherin promoter sequences (dCdh1) (left three lanes), followed by re-ChIP with anti-Id1 antibodies (IP2) and analyses of the bound (B) and unbound (NB) fractions for E-cadherin promoter sequences (dCdh1) (right two lanes). The input fraction (1/100) is shown at the left. Quantification of the amplified endogenous E-cadherin promoter compared to the input fraction (1/100) is shown in the lower panel. (E) ChIP assays were first performed with anti-EGFP (IP1) followed by re-ChIP (IP2) with anti-EGFP or anti-Id1 antibodies, as indicated, followed by analyses of the bound (B) and unbound (NB) fractions for E-cadherin promoter sequences (dCdh1). Input (1/100) and control IgG ChIP are shown on the left two lanes. Quantification of the amplified endogenous E-cadherin promoter compared to the input fraction (1/100) is shown in the lower panel.

