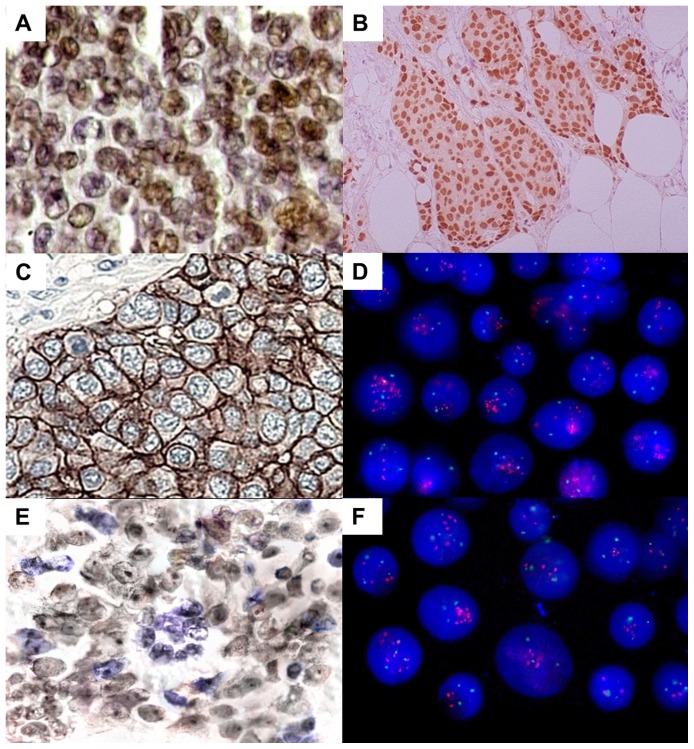
Figure 2. IHC and FISH analysis in breast tumors.
a) Progesterone immunoreactivity (400x); b) Estrogen immunoreactivity (100x); c) HER2 immunoreactivity, score 3+ (400x); d) Interphase nuclei presenting two or more signals for chromosome 17 centromere (green) and HER2 (red) (1000x); e) MYC immunoreactivity (400x); f) Interphase nuclei presenting two or more chromosome 8 centromere (green) and MYC signals (red) (1000x).

