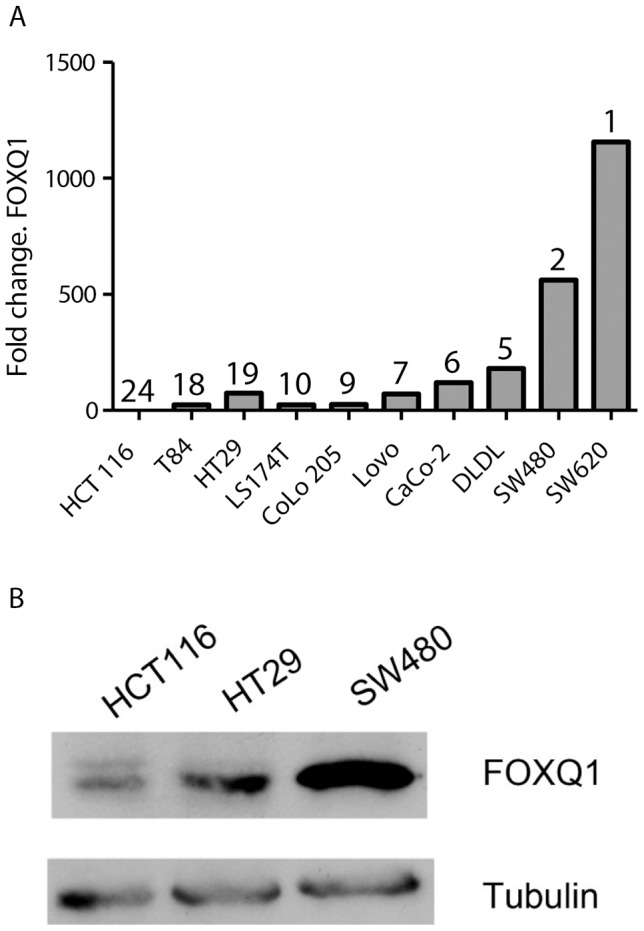
Figure 4. FOXQ1 expression correlates with overall expression strength of direct Wnt target in CRC cell lines.

(A) FOXQ1 mRNA levels were measured by qRT-PCR in a panel of CRC cell lines. Numbers indicate ranks in terms of Wnt signalling strength according to Christensen et al. [21], with rank 1 having the strongest mean Wnt signal strength. (B) Western blot of selected CRC cell lines showing the expression level of FOXQ1. Tubulin was used as loading control.
