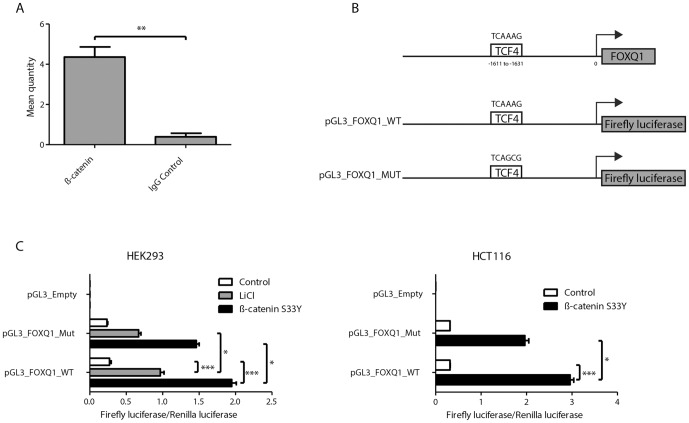
Figure 6. ß-catenin binds to the promoter region of FOXQ1 and increase transcription.
(A) ChIP assay was performed on SW480 cells with antibodies against ß-catenin and IgG (control). Input and immunoprecipitated DNA was measured by qRT-PCR using primers amplifying the promoter region of FOXQ1 and the −100/0 promoter region of GAPDH. Data are mean ± SD n = 3, **P<0.01 using Mann-Whitney test. (B) Graphical depiction of the promoter region of FOXQ1, and the generated promoter reporter vectors. (C) Luciferase assay showing the effect of Wnt activation in HEK293 and HCT116 cells (as described in figure 5) transfected with the wild type promoter region of FOXQ1 (pGL3_FOXQ1_WT), a mutated TCF4 binding site (pLG3_FOXQ1_Mut) or an empty vector (pGL3_Emtpy). Data are mean ± SD n = 4–7, *P<0.05, ***P<0.001 by the Kruskal-Wallis Conover test.

