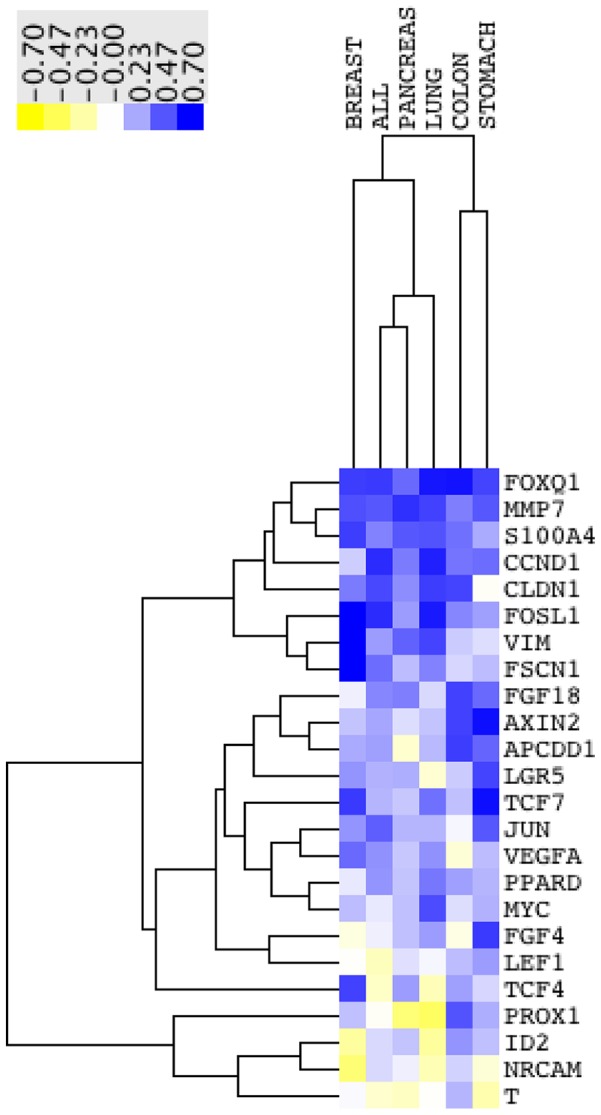
Figure 7. FOXQ1 expression correlates with the average Wnt signature strength in a wide panel of cell lines.

Heatmap showing the correlation coefficients between single genes and the mean expression of all 24 direct Wnt targets in various cancer cell lines (data set GSE36133). Colon n = 57, breast n = 58, lung = 174, pancreas n = 44, stomach n = 38, all n = 967.
