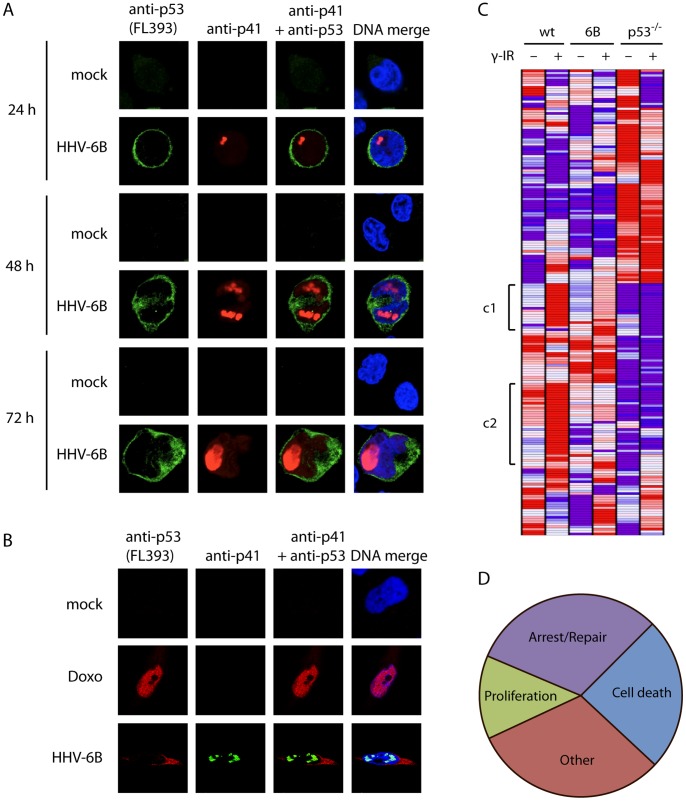
Figure 1. HHV-6B infection leads to cytoplasmic accumulation of p53.
(A) Confocal microscopy images of MOLT3 cells infected with HHV-6B for 24, 48 or 72 hrs. The cells were analyzed with antibodies against p53 (Alexa488 green), p41 (Alexa546 red) and DAPI (blue). (B) Confocal microscopy images of HCT116 cells treated with or without doxorubicine or infected with HHV-6B for 48 hrs, followed by analysis with antibodies against p53 (red), p41 (green) and DAPI (blue). (C) Heat-map showing hierarchical cluster analysis on 128 p53-target genes. Red indicates high expression and blue indicates low expression. The symbol [denotes a cluster (c1 and c2) that responds to γ radiation in the wt cells, but with no or impaired response in the HHV-6B-infected cells and p53−/− cells. (D) Functional distribution of genes from c1 and c2 in the heat-map analysis in (C). Cell death, 24.1%; Proliferation, 13.1%; Arrest/Repair, 31.1%; Other, 31.1%.

