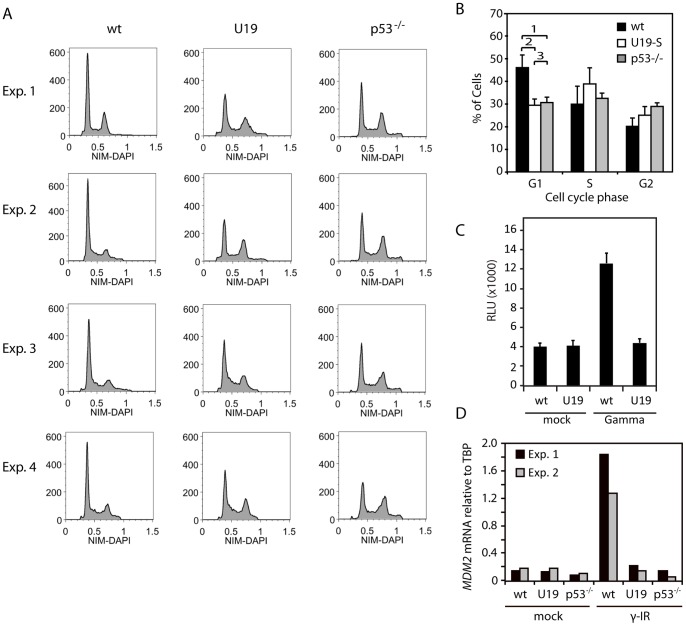
Figure 4. U19 expression inhibits p53-dependent check-point arrest.
(A) Cell cycle analyses of wt HCT116 cells, HCT116 cells stably expressing U19, and HCT116-p53−/− cells. The cells were stained with NIM-DAPI and analyzed by flow cytometry. Four independent experiments are shown. (B) Quantification of the G1, S and G2 distributions, using the Dean-Jett-Fox algorithm in the Flow-Jo software program. An average of the four independent experiments from (A) is shown. Error bars indicate SD. The p values in G1 are: 1) p = 0.0005; 2) p = 0.0003; and 3) p = 0.49 (p values were determined using a t-test). (C) Analysis of p21 promoter activation using a p21-pro-luciferase construct. HCT116 wt cells and HCT116 cells stably expressing U19 were transfected with a p21-Luc promoter construct, γ-irradiated (30 Gy followed by 24 hrs of incubation) and analyzed for luciferase induction. Y-axis depicts relative light units (RLU). A representative out of two experiments is shown. Values are average of triplicate measurements with error bars indicating SD. (D) Real-time PCR on mRNA from HCT116 wt, U19S and p53−/− cells with MDM2 or TBP specific primers. MDM2 mRNA levels are represented relative to TBP. Measurements were performed in duplicate. Two independent experiments is shown.

