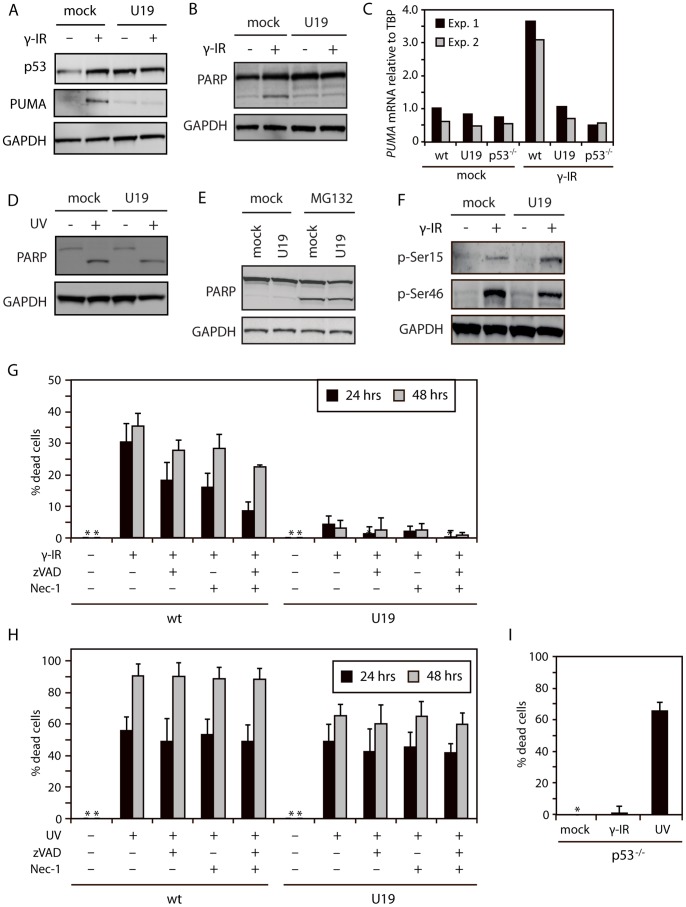
Figure 5. U19 inhibits p53-dependent apoptosis.
(A) Western blot analyses with antibodies against p53, PUMA, and GAPDH on lysates from HCT116 cells transduced with an empty or a U19 lentivirus vector and treated with or without γ radiation (30 Gy) followed by incubation for 24 hrs. (B) Western blot analyses with antibodies against PARP and GAPDH on lysates from HCT116 cells transduced with an empty or a U19 lentivirus vector and treated with or without γ radiation (30 Gy) followed by incubation for 24 hrs. (C) Real-time PCR on mRNA from HCT116 wt, U19S and p53−/− cells with PUMA or TBP specific primers. PUMA mRNA levels are represented relative to TBP. Measurements were performed in duplicate. Two independent experiments is shown. (D) Western blot analyses with antibodies against PARP and GAPDH on lysates from HCT116 cells transduced with an empty or a U19 lentivirus vector and treated with or without UV radiation (60 J/cm2) followed by 4 hrs incubation. (E) Western blot analyses with antibodies against PARP and GAPDH on lysates from HCT116 cells transduced with an empty or a U19 lentivirus vector and treated with or without MG132 for 24 hrs. (F) Western blot analyses with antibodies against p53 p-Ser15, p53 p-Ser46, and GAPDH on lysates from HCT116 cells transduced with an empty or a U19 lentivirus vector and treated with or without γ radiation (30 Gy) followed by 24 hrs of incubation. (G & H) HCT116 mock-LV (wt) and U19-LV (U19) cells where treated with or without zVAD, nec-1 or both for 1 hr followed by γ irradiation (30 Gy) or UV treatment (60 J/cm2) for 24 or 48 hrs. Cell viability was assessed by measuring intracellular ATP-levels. Data are shown as % dead cells calculated relative to untreated cells. Measurements were performed in duplicate. An average of three independent experiments is shown. Error bars represent SD. (I) HCT116 p53−/− cells were treated with or without γ radiation (30 Gy) or UV (60 J/cm2) for 24 hrs followed by analysis of intracellular ATP levels. Measurements were performed in duplicate. An average of three independent experiments is shown. Error bars represent SD.

