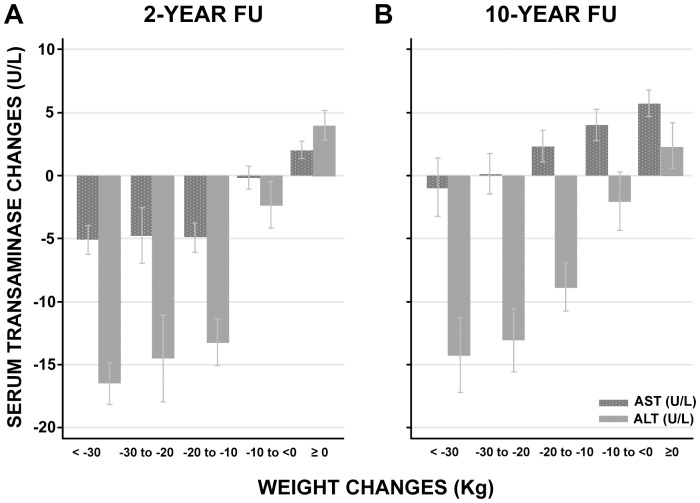
Figure 2. Serum transaminase changes and their relation to body weight changes at 2- and 10-year follow up.
The serum transaminase changes are expressed as mean and 95% confidence intervals. The surgery and control groups are pooled. Changes are calculated as the difference between follow up (2 or 10 year) and baseline values. Abbreviations: FU, follow up; AST, aspartate transferase; ALT, alanine transferase.

