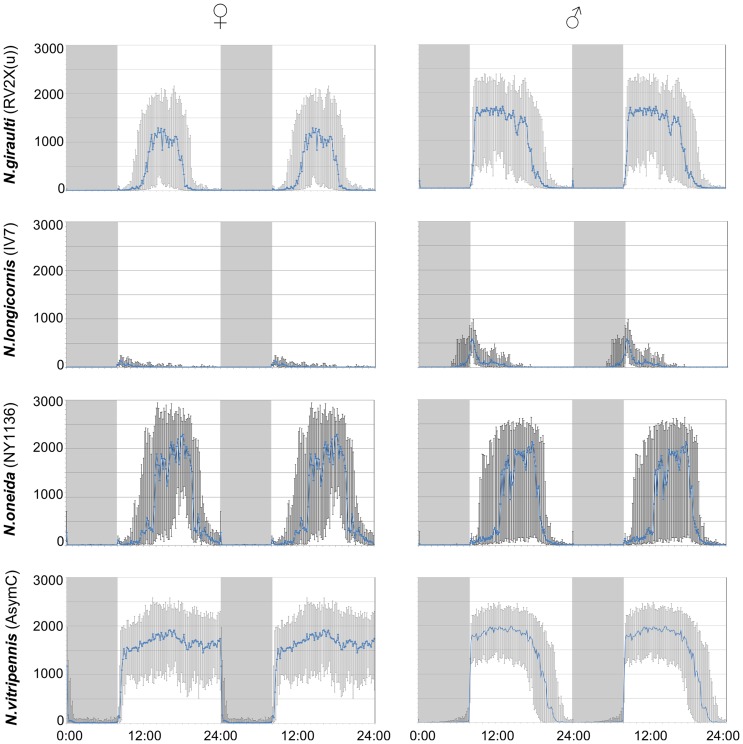
Figure 2. Average activity during LD in standard strains.
The median (with lower and upper quartiles) of the activity over the last three days in LD (double plotted) is indicated for each sex in the standard strains used for each species. Gray background indicates darkness. Y-axis: activity (pixel changes/minute); x-axis: hour of the day.

