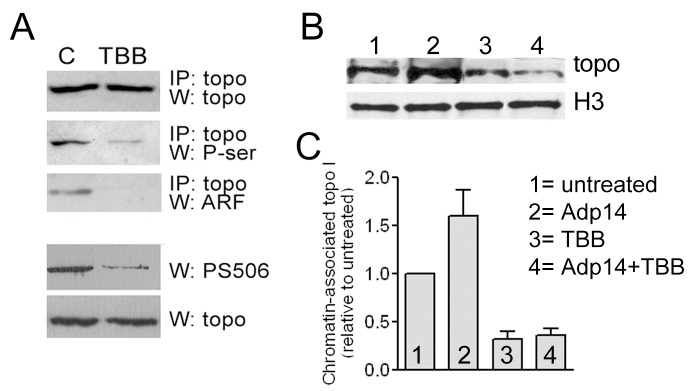
Figure 3. Chromatin association of topo I.

(A) Rows 1–3: Topo I IP followed by Western analyses of total topo I, phosphoserine, and ARF was performed before (lane “C”) or 2 days after (lane “TBB”) treatment of H358 cells with TBB (10 µM for 1 h); rows 4 and 5: Western analyses of PS506 and total topo I in the same starting samples as in rows 1–3. Quantification of band densities indicated that TBB treatment reduced both P-ser and PS506 reactivity by ∼80%. (B) Histone H3 chromatin immunoprecipitation (ChIP) of untreated H358 cells (lane 1) or 2 days after treatment with 20 moi Adp14 (lane 2), TBB (10 µM, 1 h; lane 3), or both Adp14 and TBB (lane 4), followed by Western analyses of histone H3 and topo I. (C) The results of four independent ChIP analyses performed as in (B); bars represent the mean and standard deviation of chromatin-associated topo I levels in the treated cells relative to the untreated cells, quantified digitally from band intensities.
