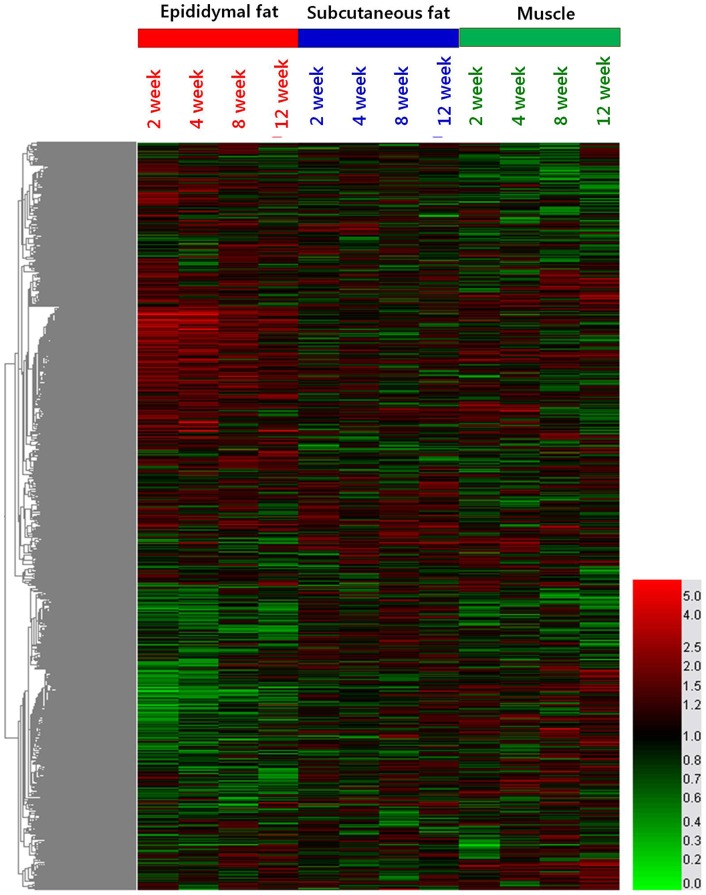
Figure 2. Heatmap of differentially expressed transcript sets.
Values used for clustering are average HFD vs. ND per time-point expression ratio. The branches of the condition tree are colored so to discriminate three subclusters with the largest distance, corresponding to three tissues of the time-course: epididymal adipose tissue (red), subcutaneous adipose tissue (blue) and gastrocnemious muscle (green). This is summarized in the color bar underneath the cluster diagram.

