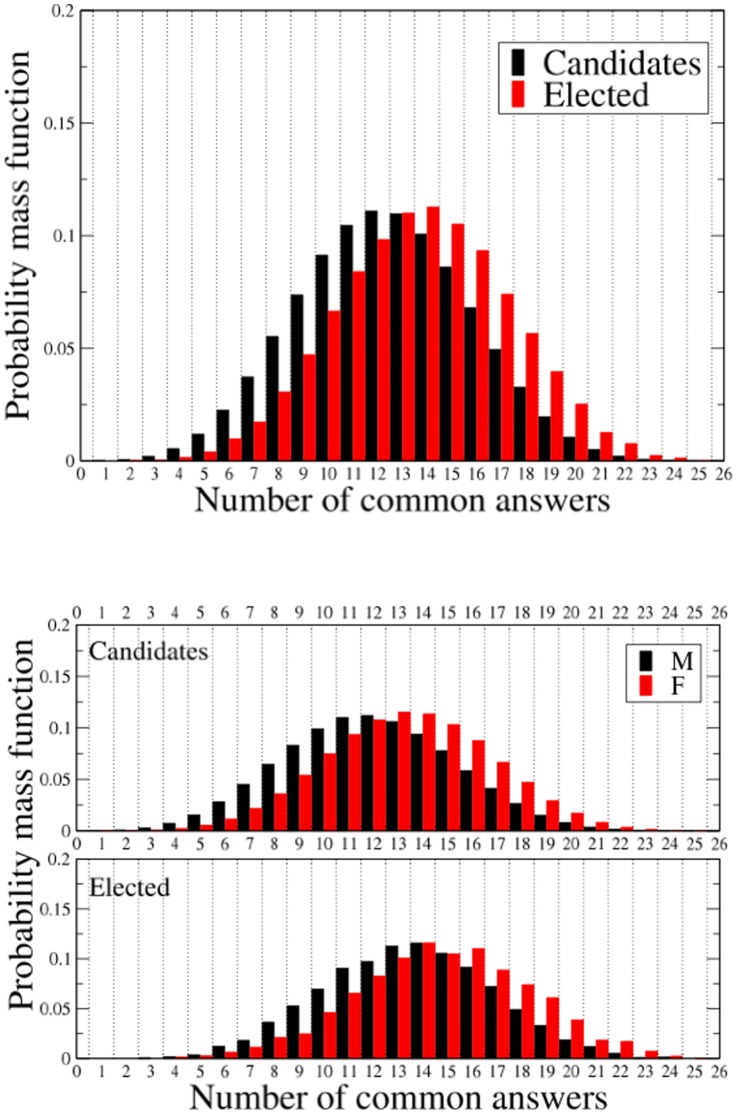
Figure 1. Probability mass functions of the number of common answers.
Comparison between the probability mass function of the number of common answers between respondents, separately for candidates and elected (top panel) and disaggregated by gender (bottom panel). The probability mass functions are obtained by considering the answers of all 1,793 candidates who provided information about the gender, and the subset of 181 elected candidates.

