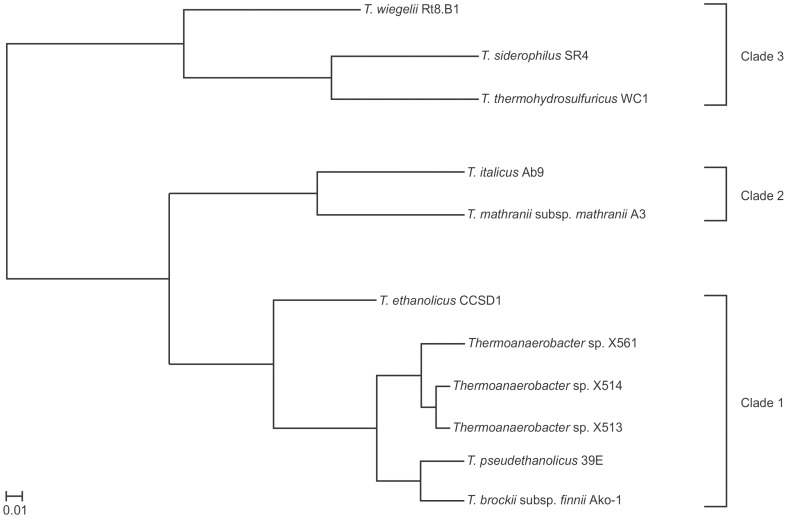
Figure 2. Phylogram of annotated COG functional profiles for sequenced Thermoanaerobacter strains.
Cluster analysis, based on Cluster 3.0 analysis software [120], was conducted within the IMG-ER platform using the COG profiles for each genome. Branch lengths correspond to calculated distances between functional profiles. Similar clade architectures are observed when using KO or TIGRFAM descriptors (not shown).

