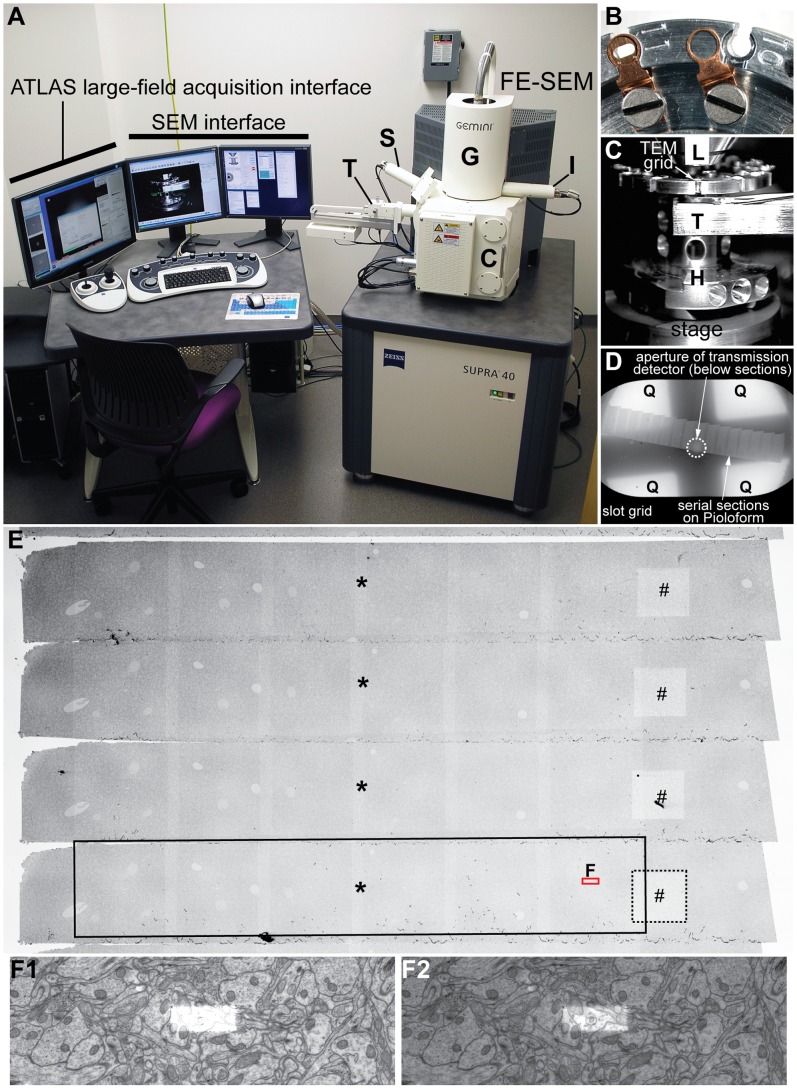
Figure 1. tSEM instrumentation.
A: Zeiss SUPRA 40 field emission scanning electron microscope equipped with a secondary electron detector (S), an in-lens detector (I), and a retractable detector for transmitted electrons (tSEM detector; T). The column (G) contains the gun assembly and objective lenses. The specimen chamber door (C) slides open outward with the stage. The SEM is controlled through the SEM interface and console of keyboard, mouse, joysticks, or the integrated ATLAS system for large-field imaging. The SEM can also be fitted with a backscatter electron detector (not shown). B: Top view of the specimen holder magnified to show two of the grid holding positions (10 and 11). Position 10 is empty and the copper clip is disengaged to the left of the slot, while position 11 contains a TEM grid (3 mm diameter) with the clip engaged. C: TV camera view of the specimen chamber showing the arrangement of the final lens (L), tSEM detector (T), and sample holder (H) on the stage. Working distance is 4–5 mm between the final lens and the specimen, and 4–5 mm between the specimen and the detector. Chamber vacuum is maintained at <10−7 Pa during imaging. D: Low-magnification tSEM image of an entire slot grid containing serial sections. Below the sections, the aperture of the tSEM detector can be seen (circle with dotted line), which must to be aligned to the center of the image field. Four quadrants (Q) of the detector element are also used for imaging by collecting electrons scattered at higher angles. Imaging mode (normal or inverted) can be set for each detector element on the SEM interface. E: SEM secondary electron image of another set of serial sections (different from that shown in D). Each section measures about 510 µm width×71 µm height. This image was taken after acquisition of two image series, one consisting of single frame images (32 µm×32 µm surrounding the #) and the other consisting of mosaic images (6 columns×1 row; 360 µm width×64 µm height, surrounding the *). These image fields are seen as brightened areas on each section (outlined by dotted and black boxes in the bottom section). Regardless of the target image size (single or mosaic field), the operator is required to mark only the center of each field (indicated by “#” or “*”,) to set up the serial image acquisition. The area outlined by a red box (“F”) is further magnified in F1–2. F1–2: Magnified view of a subfield measuring 10.8 µm×3.6 µm around the center of the image tile indicated in E. The brightened area in the center is where repeated scans took place during the autofocus routine. If the image brightness is adjusted to the entire field, the autofocus area becomes too bright to discern ultrastructure within this area (F1). As demonstrated in F2, however, these repeated scans during the autofocus routine do not cause loss of the underlying tissue structure. The original tSEM image was acquired as a 16-bit TIFF file at 2 nm pixel size. The image brightness was optimized for either the entire image field or the autofocus area to generate the images in F1 and F2. These images were then converted to 8-bit TIFF files and down-sampled to 12 nm pixel size for the final figure.

