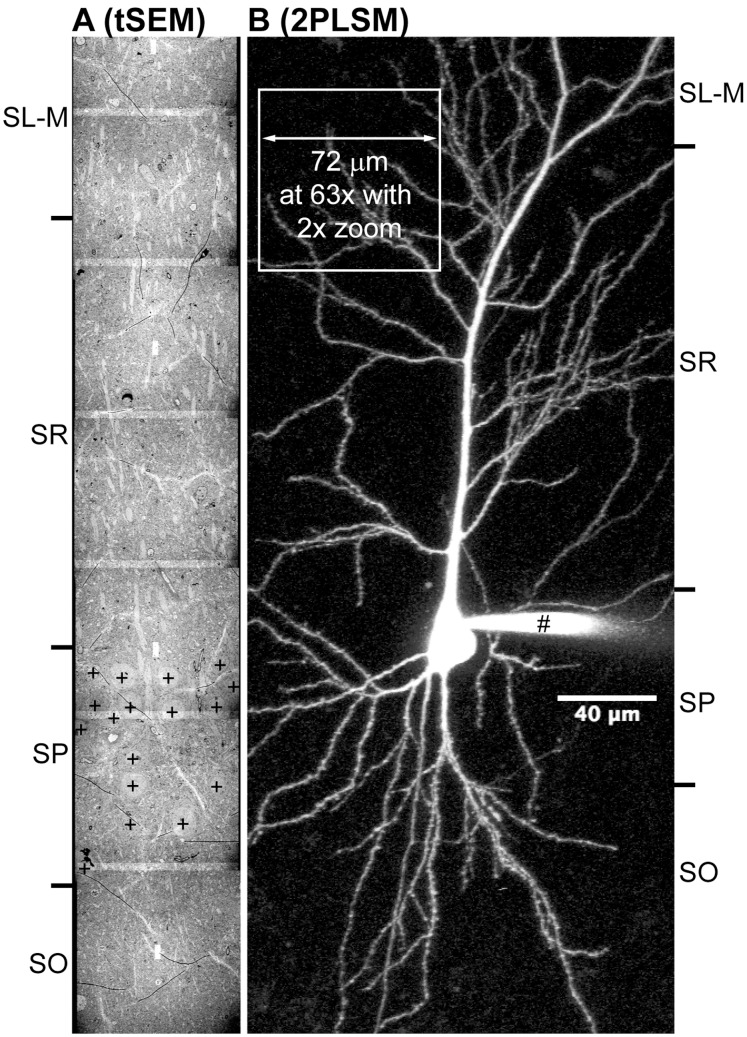
Figure 6. Field size comparison of images acquired on tSEM and two-photon laser-scanning microscope (2PLSM).
A: A tSEM image containing a mosaic of 7 image tiles, from rat hippocampal area CA1, with the field size measuring 67 µm×399 µm. Overlaps between image tiles appear as lighter bands. Soma of the pyramidal neurons are indicated by “+”. The original image tiles were taken as 10×1 mosaic covering 608 µm×65 µm area (32,768×32,768 pixels per tile at 2 nm pixel size), encompassing all layers in the area CA1 (SO = Stratum Oriens; SP = Stratum Pyramidale; SR = Stratum Radiatum; SL-M = Stratum Lacunosum Moleculare). The image tiles were stitched together with Fiji/TrakEM2, down-sampled to 223 nm pixel size, rotated 90°, and cropped to 303×1792 pixels (67 µm×399 µm) to scale with the image in B. B: A pyramidal neuron in the rat (10-week old) hippocampal area CA1 was filled with Alexa 594 dye (40 µM) with a patch pipette (#). The original fluorescence image stack was acquired using laser tuned to 880 nm (Spectra Physics Mai Tai) on a 2PLSM (Leica SP 5 RS) with a 20× water immersion objective (N.A. = 1.0). Image field size was 1024×1024 pixels (455.88 µm×455.88 µm and 120 µm deep; 255 optical sections), which was then projected and cropped to 384×896 pixels (171 µm×399 µm). White box indicates calculated field for imaging with a 63× objective and 2× digital zoom (i.e., 455.88 µm/[63/20]/2 = 72.36 µm), which is on the order of single field size of a tSEM image. Scale bar is valid for both A and B. Image courtesy of R. Chitwood, Center for Learning and Memory, The University of Texas at Austin.

