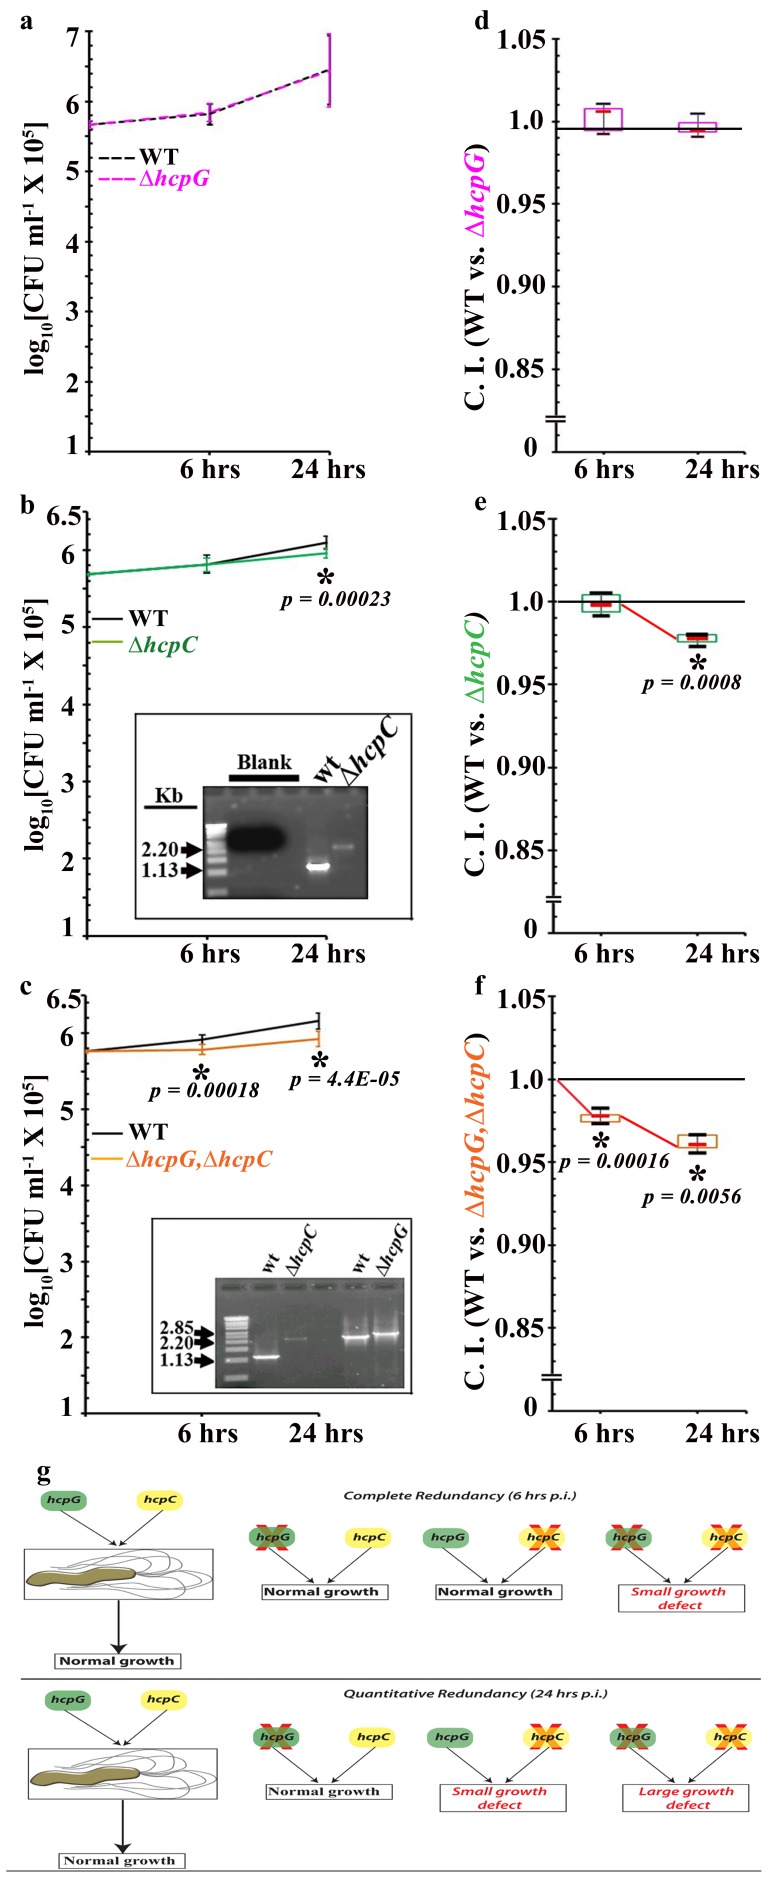
Figure 3. hcpC and hcpG can be completely or quantitatively redundant.
(a) Growth curves for the ΔhcpG mutant derivative and HpG27MA WT strain. (b) Growth curves for the ΔhcpC mutant and HpG27MA WT strains. Inset: PCR performed to verify the presence of both strains in the infection mix. (c) Growth curves for the ΔhcpG,ΔhcpC double mutant and HpG27MA WT strains. Inset, PCR performed to verify the presence of both strains in the infection mix. (d) Unbiased box and whisker plot representation of the CI for the ΔhcpG mutant. (e) CI measurements for the ΔhcpC mutant. (f) CI measurements for the ΔhcpC,ΔhcpG double mutant. The median reduction in the CI from 6 to 24 h after infection is indicated by the red connector. The asterisks indicate significant P-values. The results show the averages from five experiments (± SD). (g) Interpretation and representation of complete and quantitative redundancy of hcpG and hcpC in competition assays.

