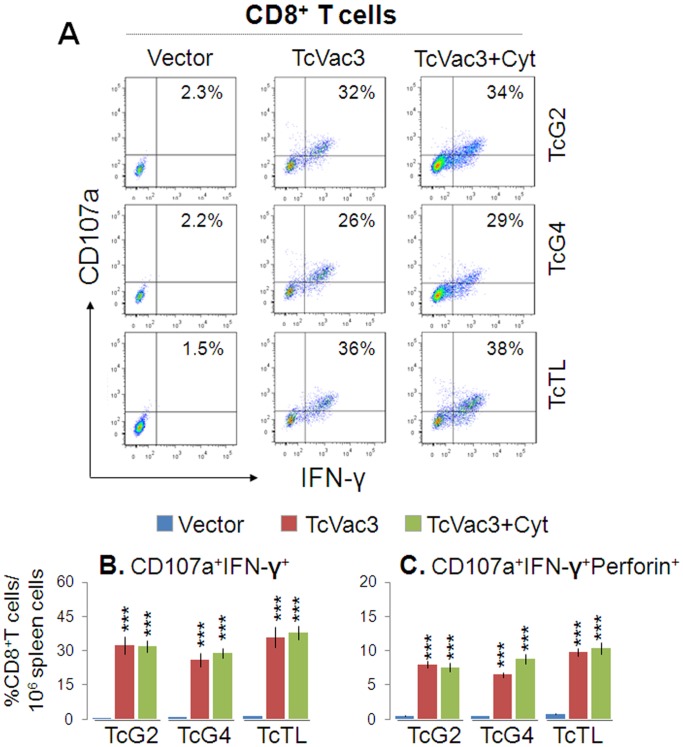
Figure 3. Cytolytic functional profile of TcVac3-induced splenic CD8+T cells.
Mice were immunized as above, and splenocytes harvested two-weeks after last dose were in vitro stimulated with recombinant antigens or TcTL. (A) Shown are representative quadrant images acquired by flow cytometry of PE+CD8+T cells exhibiting CD107a+ (Alexa Fluor 488) and IFN-γ+ (e-Fluor) phenotype. (B&C) Percentage of antigen-specific and Tc-specific CD8+IFN-γ+T cells that were CD107a+ (B) and CD107a+Perforin+ (C), acquired from flow cytometry analysis.

