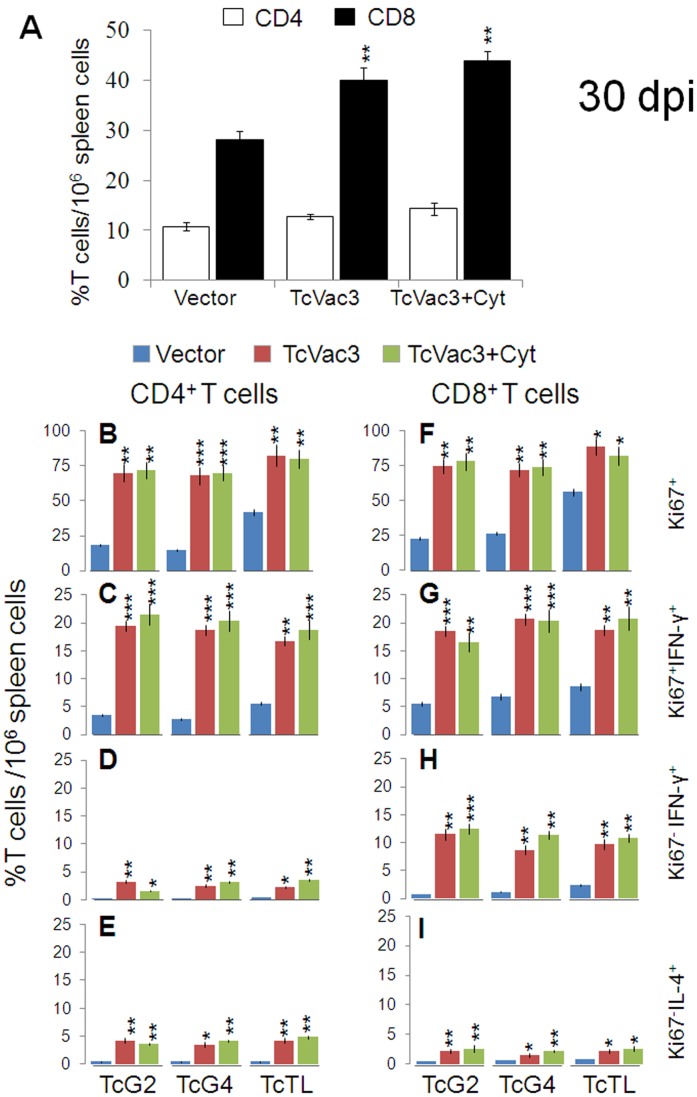
Figure 5. Functional profile of TcVac3-induced T cells in response to challenge infection by T. cruzi.
Mice were injected with empty vector or TcVac3 (± cytokine adjuvants), infected with T. cruzi, and harvested at day 30 post-infection. (A) Splenic T cell profile was determined by flow cytometry after staining with FITC-conjugated anti-CD8 and PE-conjugated anti-CD4 antibodies. (B–I) Splenocytes were in vitro stimulated with recombinant antigens or TcTL for 48 h, and incubated with fluorescent-conjugated antibodies as described in Fig. 2. Shown are the CD4+ (B–E) and CD8+ (F–I) proliferating (Ki67+, B,C,F,G), and non-proliferating (Ki67−, D,E,H,I) T cell subsets and their intracellular cytokine (IFN-γ: C,D,G,H; IL-4: E&I) profile, measured by flow cytometry.

