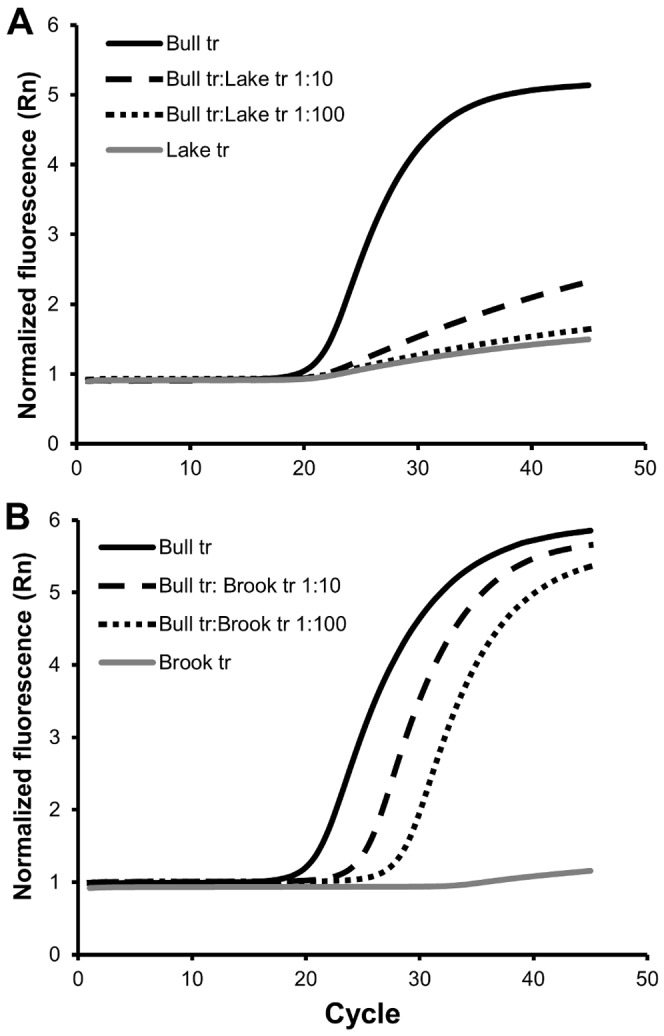
Figure 3. Non-target template competition in the bull trout assay.

Part A shows the amplification curves of BUT1 when using DNA solutions from bull trout, lake trout, and bull trout mixed into lake trout at 1∶10 and 1∶100 dilutions. Part B shows the amplification curves of BUT1 when using DNA solutions from bull trout, brook trout, and bull trout mixed into brook trout at 1∶10 and 1∶100 dilutions. The assay primers have nine and five primer base pair mismatches with brook trout and lake trout respectively. Four of the mismatches with brook trout are within five base pairs of the 3′ primer ends, but none of the mismatches with lake trout are near the 3′ ends. The assay is not influenced by the presence of brook trout, but produces an ambiguous signal when bull trout represents a small portion of the sample.
