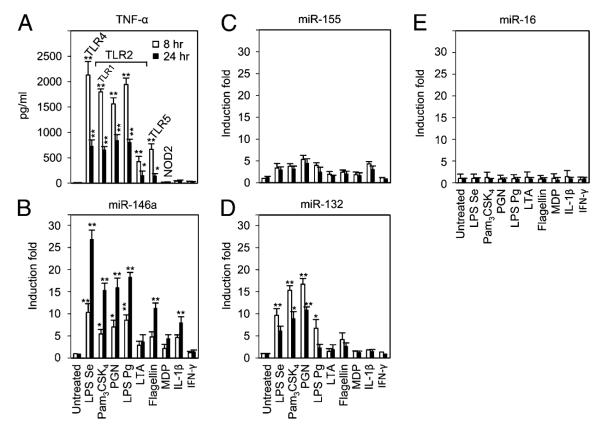
FIGURE 1.
TNF-α protein secretion and miRNA expression kinetics in response to a panel of innate immune ligands in THP-1 monocytes. THP-1 cells were incubated with various ligands for 8 or 24 h, as indicated at the foot of the graphs. TNF-α in culture supernatants was measured by ELISA (A). Total RNAs were purified from the respective cell pellets, and the expressions of miR-146a (B), miR-155 (C), miR-132 (D), and miR-16 (E) were analyzed by qRT-PCR. miRNA expressions were normalized with RNU44. All results are expressed as mean ± SD from three independent experiments. *p < 0.05; **p < 0.01 compared with untreated cells.

