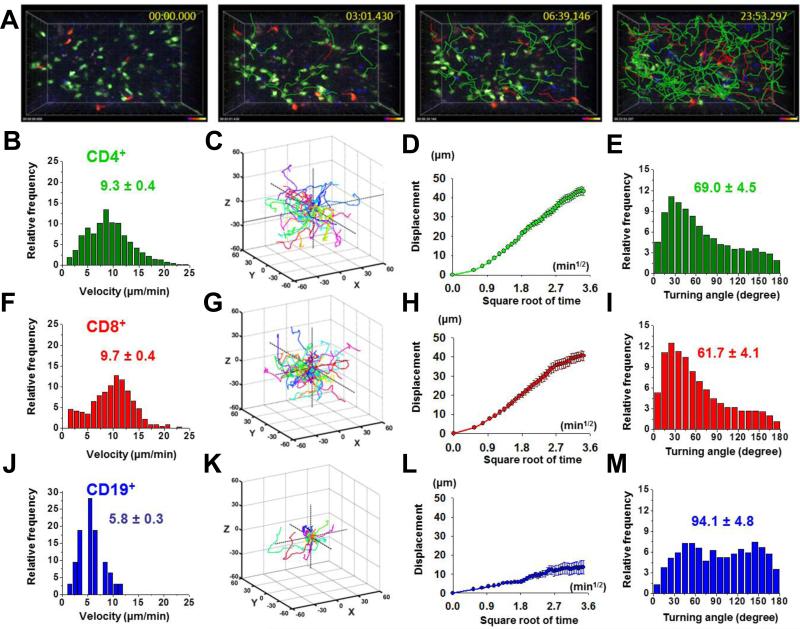
FIGURE 1.
Human lymphocytes actively migrate through explanted lymph nodes of NOD.SCID mice. A, Time lapse images of migrating human lymphocytes, showing human CD4+ T cells (green), CD8+ T cells (red), and CD19+ B cells (blue). Correspondingly colored cell tracks depict cell movements over the indicated time periods. B, Distribution of mean cellular velocities of 108 human CD4+ T cells. Overall mean ± SEM indicated. C, Three-dimensional tracks of 20 human CD4+ T cells monitored over 10 min, normalized to their starting coordinates. D, Mean displacement of the 20 T cells as a function of the square root of time. E, Turning Angles between individual CD4+ T cell steps over 10 min intervals, shown with mean angle ± SEM. F, Mean cellular velocities of human CD8+ T cells, 118 individual cell tracks. G, Three-dimensional tracks of 20 human CD8+ T cells monitored throughout ten-minute intervals. H, Mean displacement of the 20 T cells. I, Distribution of turning angles between CD8+ T cell steps. J, Mean cellular velocities of human CD19+ B cells, 98 individual cell tracks. K, Three-dimensional tracks of 10 human CD19+ B cells monitored throughout 10 min intervals. L, Mean displacement of the 10 B cells. M, Distribution of turning angles between CD19+ B cell steps.

