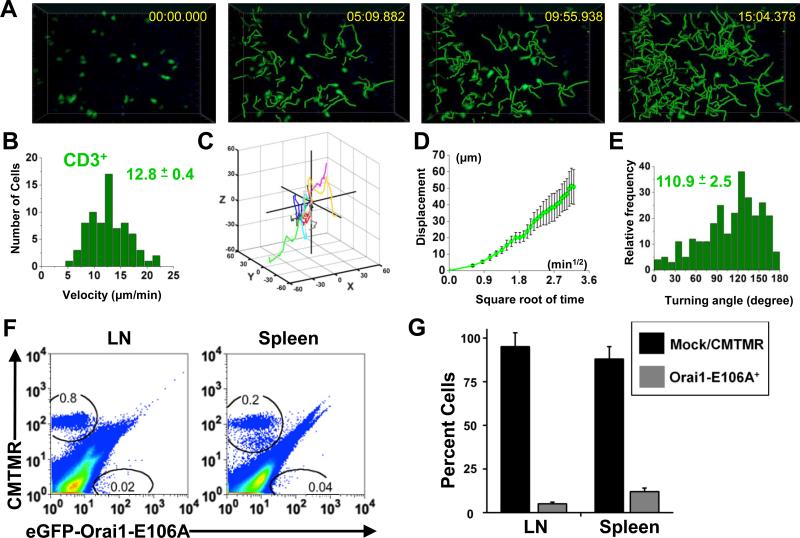
FIGURE 4.
Human T cell motility and homing in the SLO of reconstituted NOD.SCID.B2 mice. A, Time lapse two-photon image in an explanted reconstituted NOD.SCID.B2 lymph node, showing transferred human CD3+ T cells labeled with CMTMR (pseudocolored green). Panels depict cell positions at the times indicated, together with superimposed tracks depicting progressive cellular migration since the beginning of the record. B, Mean cellular velocities of human CD3+ T cells shown with the mean ± SEM, 74 individual cell tracks. C, Three-dimensional tracks of 10 human CD3+ T cells monitored throughout over 10 min intervals, normalized to starting coordinates. D, Mean displacement of the 10 T cells as a square root function of time. E, Distribution of turning angles between individual CD3+ T cell steps over 10 min intervals shown with mean turning angle ± SEM. F, Homing of control CMTMR+ or eGFP-Orai1-E106A+ human CD3+ T cells in the reconstituted NOD.SCID.B2 mouse. T cell gates are drawn as indicated. G, Percent ± SEM of recovered cells following adoptive transfer, detected by flow cytometry (three individual donors). p < 0.001.

