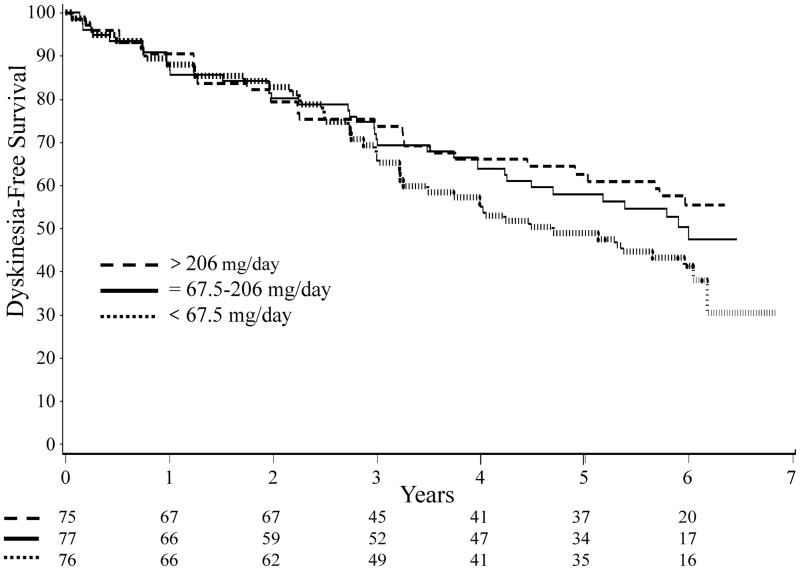
Figure 2. Kaplan-Meier curves for time to dyskinesia stratified by tertile of prior caffeine use.
Total number at risk in each tertile is shown at the bottom of the graph. Dashed line: > 206 mg/day of caffeine; solid line: 67.5–206 mg/day of caffeine; dotted line: < 67.5 mg/day of caffeine (log-rank test, p=0.19).

