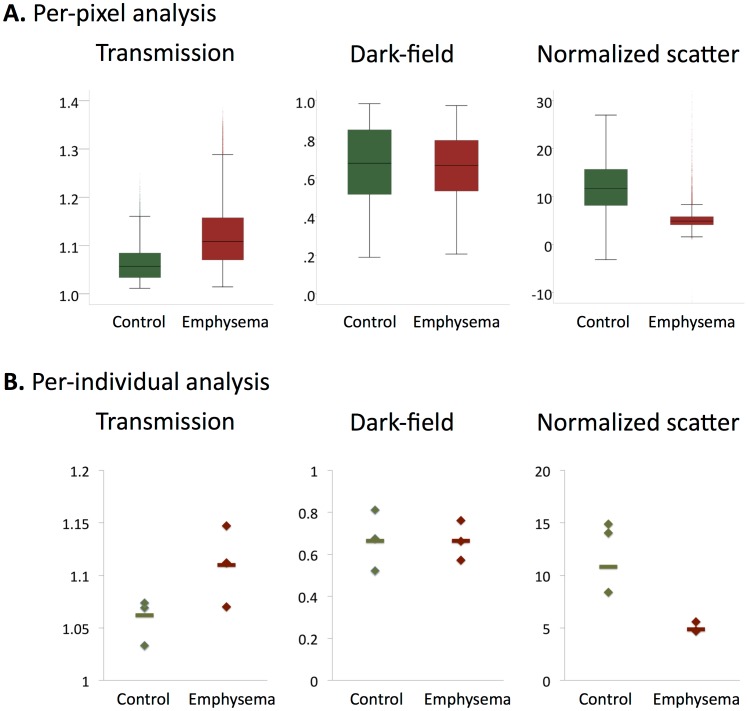
Figure 2. Signal characteristics of emphysematous and control lungs.
The distribution of transmission, dark-field and normalized scatter values are shown as boxplots for emphysematous and control lungs in a per-pixel (A) and a per-individual (B) analysis. For the per-individual analyses median values over all 11 projections of each specimen were used (depicted as rhombs). Additionally, the median value over all projections of all specimens from the respective group is shown (horizontal bar).

