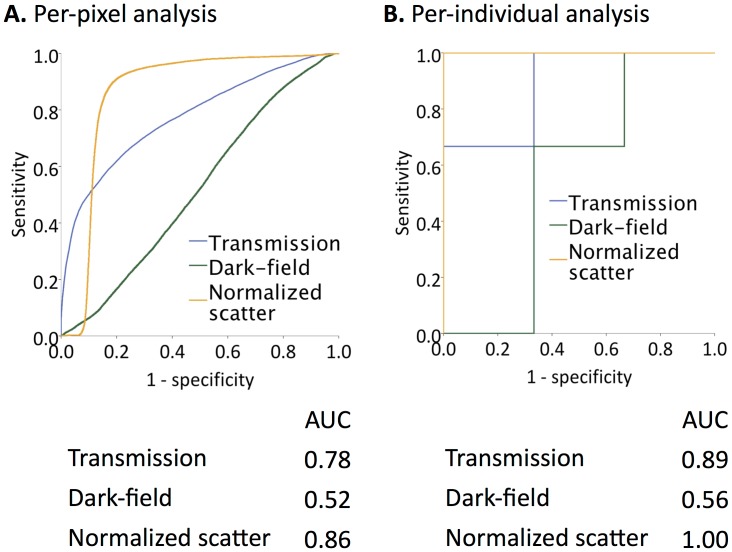
Figure 3. ROC Analysis.
Receiver-operator-characteristic (ROC) curves are shown both in a per-pixel (A) and a per-individual (B) analysis. For the per-individual analyses median values over all 11 projections of each specimen were used. The corresponding areas under the curve (AUCs) are listed below.

