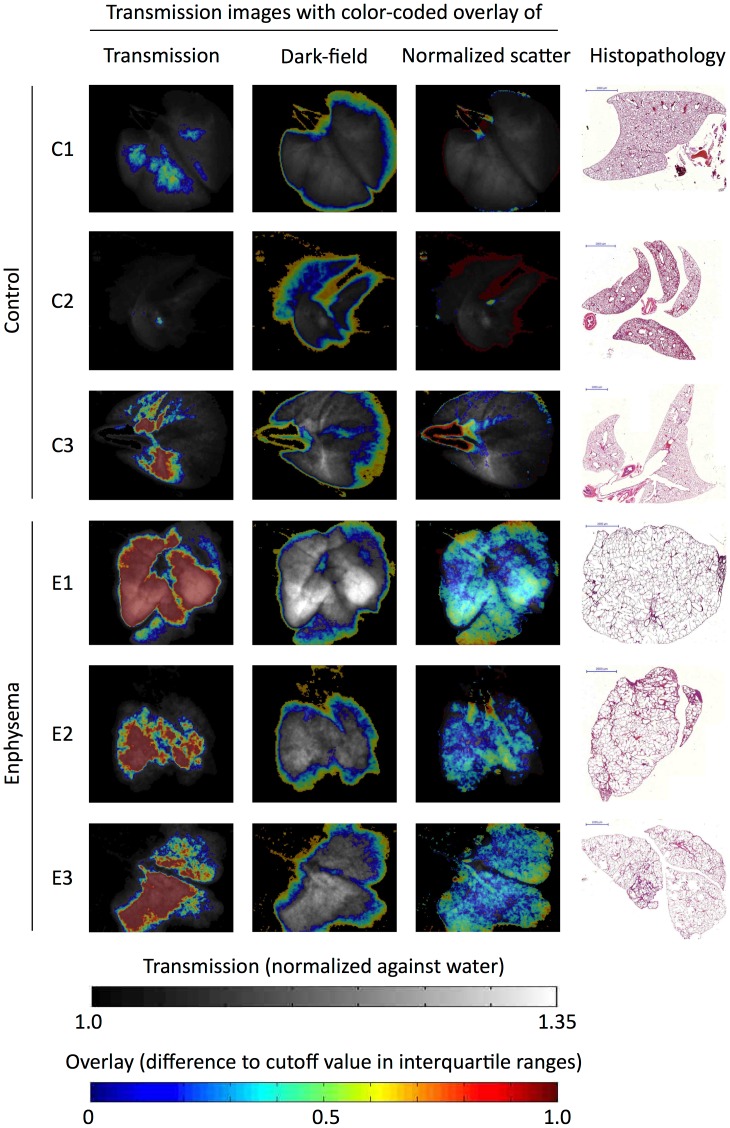
Figure 4. Parametric maps of emphysema distribution.
To generate parametric maps of emphysema distribution, the difference between pixel values of transmission (left column), dark-field (second column from left) and normalized scatter (third column from left) from the respective “optimal” cutoff value (determined in the ROC analysis to maximize AUC) was calculated for each pixel and normalized against the interquartile range of this parameter in the control lungs. The resulting values were color-coded on a scale ranging from 0–1 interquartile ranges. Only deviations towards the “emphysematous” signal characteristic were color-coded such as to identify diseased tissue. The resulting color-coded parametric maps were superimposed onto the transmission images depicted in gray scale. Histopathologic images obtained by Mayer’s hematoxylin and eosin (H&E) staining of the corresponding specimen are shown (right column).

