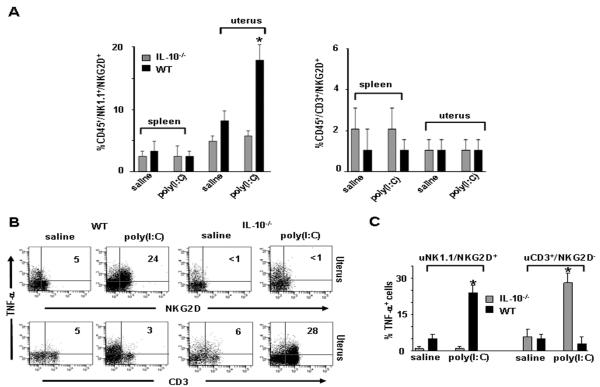
Figure 3. Induction of NKG2D in NK1.1+/TNF- α+ uNK cells in WT mice in response to poly(I:C).
(A) Representative plots of splenic or uterine CD45+NK1.1+NKG2D+ and CD45+CD3+NKG2D+ cells as analyzed by FACS from gd10 WT or IL-10−/− mice treated on gd6 with saline or poly(I:C). Graphs are average of cell populations from 8 mice per condition, (*; p<0.05) indicates significance between saline and poly(I:C) treatment conditions. (B) Representative FACS analysis of intracellular TNF-α in uterine CD45+ cells gated on the NKG2D+ and CD3+ subpopulations from gd10 WT or IL-10−/− mice treated on gd6 with saline or poly(I:C). (C) Summary graphs of TNF-α+ cells gated NK1.1+/NKG2D+ and CD3+/NKG3D− isolated from uterine tissue (n=8 mice/ condition). *; p<0.05 shows significance between saline and poly(I:C) treatment conditions.

