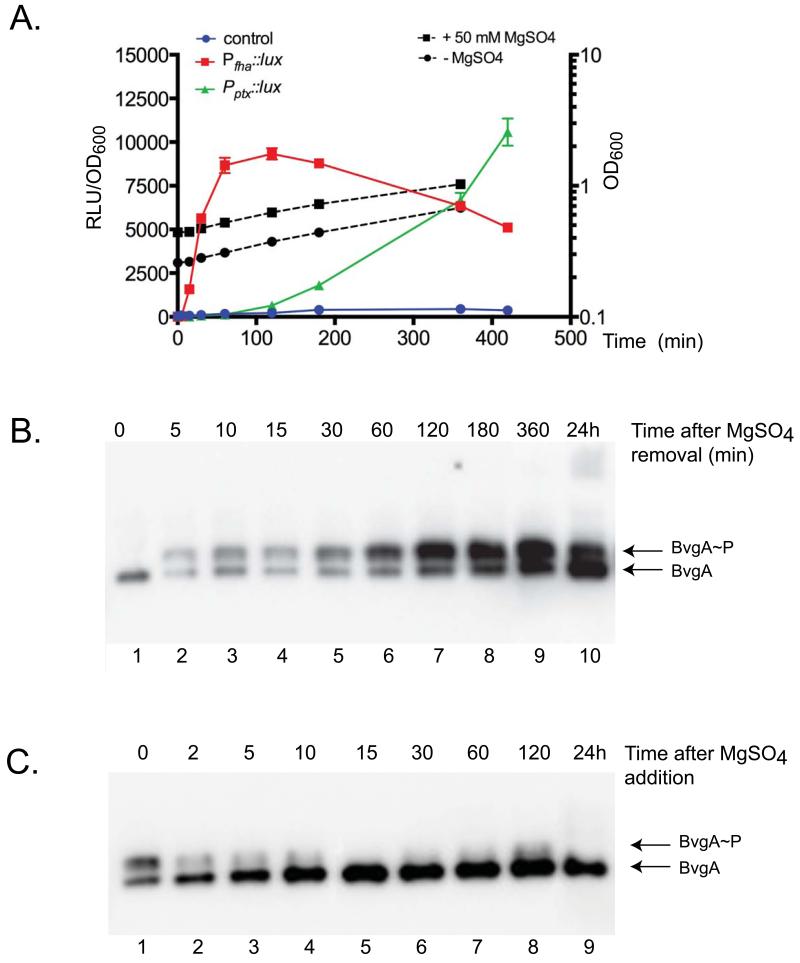
Figure 2. Kinetics of BvgA phosphorylation and gene expression in B. pertussis following modulation, or relief of modulation, of BvgAS kinase.
A. Level of gene expression and cell growth at different time points after removal of 50 mM MgSO4.
A vector carrying a transcriptional fusion of PfhaB, Pptx, or no promoter (control) with the luxCDABE operon was integrated in single copy in the BP536 chromosome. At the zero time point cells in liquid PLB medium were shifted from a non permissive (+MgSO4) to a permissive medium (−MgSO4) and OD600 as well as luminescence were monitored. The results shown here represent the assay repeated 4 times with triplicate sample reading at each time point. The left Y-axis corresponds to the relative luminescence in arbitrary units (RLU) normalized by OD600. Dashed black lines represent growth curves of both cultures monitored by OD600, with reference to the right Y-axis.
B., C. Levels of BvgA and BvgA~P at different time points after removal (B) or addition (C) of 50 mM MgSO4. At t=0, cells were shifted from a permissive (−MgSO4) to a non-permissive medium (+MgSO4) or vice versa. At the indicated times, cells were harvested. Cell lysates were subjected to Phos-tag™ gel electrophoresis and Western blot.

