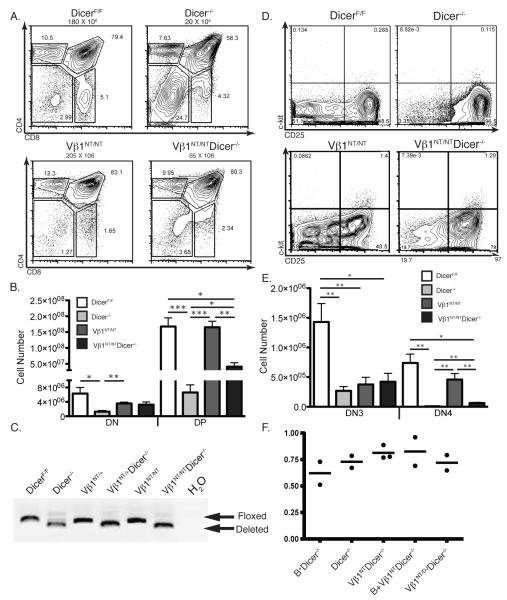
FIGURE 1.
A pre-assembled functional TCRβ gene partially rescues early αβ T-cell development. A, Representative CD4/CD8 FACS data of thymocytes from DicerF/F, Dicer−/−, Vβ1NT/NT, and Vβ1NT/NTDicer−/− mice. The average numbers of total thymocytes, the DN, DP, CD4+ SP and CD8+ SP cell gates, and the percentage of thymocyte in each gate are indicated. B, Graph showing the average numbers of DN and DP thymocytes from mice of the indicated genotypes. Error bars are standard error. Significant differences: *p<0.05, **p≤0.01, and ***p≤ 0.001. This experiment was independently performed five times with at least one mouse of each genotype in each experimental replicate. C, PCR analysis showing equivalent deletion of Dicer in total thymocytes of mice of the indicated genotypes. D, Representative c-Kit/CD25 FACS data of DN thymocytes from DicerF/F, Dicer−/−, Vβ1NT/NT, and Vβ1NT/NTDicer−/− mice. The DN1, DN2, DN3, and DN4 thymocyte quadrants and the percentage of DN cells in each quadrant are indicated. E, Graph showing the average numbers of DN3 and DN4 cells from mice of the indicated genotypes. Error bars are standard error. Significant differences: *p<0.05 and **p≤0.01. This experiment was independently performed five times with at least one mouse of each genotype in each experimental replicate. F, qPCR analysis showing equivalent deletion of Dicer in DN thymocytes sort-purified from mice of the indicated genotypes (mice expressing the EμBCL2 transgene are designated B+ in this figure). The dots represent data from individual mice and the bars indicate the average values from mice of each genotype.

