FIGURE 2.
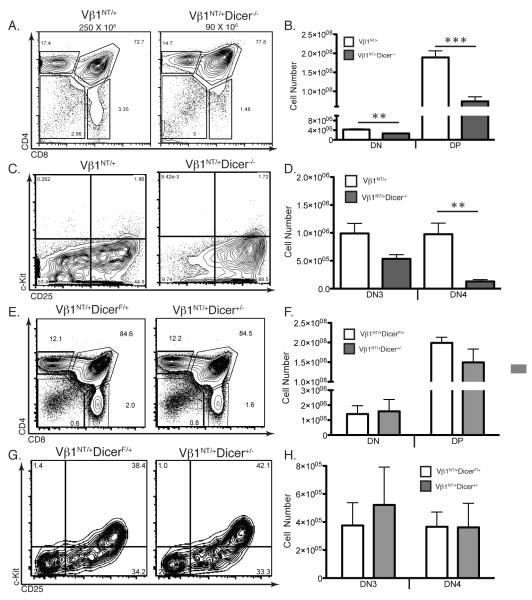
Vβ1NT Expresssion Partially Rescues Development of Dicer Deficient Thymocytes. A, Representative CD4/CD8 FACS analysis of thymocytes from Vβ1NT/+ and Vβ1NT/+Dicer−/− mice. The average numbers of total thymocytes, the DN, DP, CD4+ SP and CD8+ SP cell gates, and the percentage of thymocytes in each gate are indicated. B, Graph showing average numbers of DN and DP thymocytes from Vβ1NT/+ and Vβ1NT/+Dicer−/− mice. Error bars are standard error. No significant differences were observed. This experiment was done three independent times on at least one mouse of each genotype. C, Representative c-Kit/CD25 FACS data of thymocytes from Vβ1NT/+ and Vβ1NT/+Dicer−/− mice. The DN1, DN2, DN3, and DN4 quadrants and the percentage of DN cells in each quadrant are indicated. D, Graph showing average numbers of DN3 and DN4 thymocytes from Vβ1NT/+ and Vβ1NT/+Dicer−/− mice. Error bars are standard error. Significant differences: **p<0.01. This experiment was done three independent times on at least one mouse of each genotype. E, Representative CD4/CD8 FACS analysis of thymocytes from Vβ1NT/+DicerF/+ and Vβ1NT/+Dicer+/− (LckCreVβ1NT/+DicerF/+) mice. The DN, DP, CD4+ SP and CD8+ SP cell gates and the percentages of thymocytes in each gate are indicated. F, Graph showing average numbers of DN and DP thymocytes from Vβ1NT/+DicerF/+ and Vβ1NT/+Dicer+/− mice. Error bars are standard error. No significant differences were observed. This experiment was done three independent times on at least one mouse of each genotype. G, Representative c-Kit/CD25 FACS data of thymocytes from Vβ1NT/+DicerF/+ and Vβ1NT/+Dicer+/− mice. The DN1, DN2, DN3, and DN4 quadrants and the percentage of DN cells in each quadrant are indicated. H, Graph showing average numbers of DN3 and DN4 thymocytes from Vβ1NT/+DicerF/+ and Vβ1NT/+Dicer+/− mice. Error bars are standard error. No significant differences were observed. This experiment was done three independent times on at least one mouse of each genotype.

