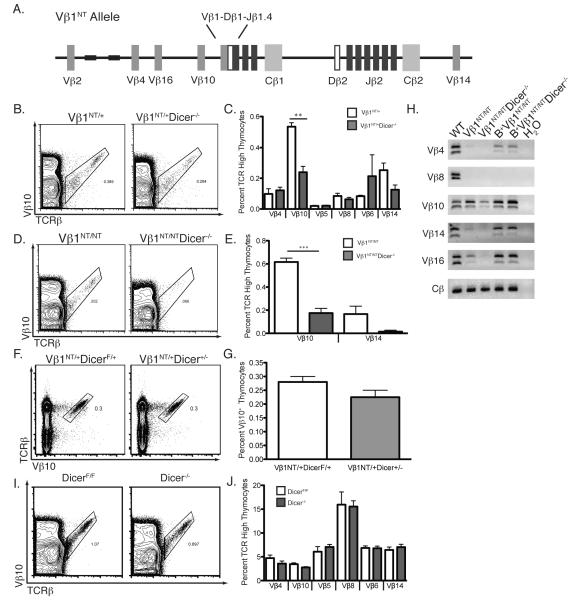
FIGURE 3.
Dicer is required for expression and accessibility of Vβ10 segments on Vβ1NT alleles. A, Schematic representation of the Vβ1NT TCRβ locus showing the relative locations of the pre-assembled Vβ1NT coding join and the germline Vβ and Dβ2-Jβ2 segments. B, Representative TCRβ/Vβ10 FACS data from Vβ1NT/+ and Vβ1NT/+Dicer−/− mice. The Vβ10+ cell gate and the percentage of thymocytes in this gate are indicated. C, Graph showing the average percentages of TCRβhigh thymocytes expressing the indicated Vβ segments in Vβ1NT/+ and Vβ1NT/+Dicer−/− mice. Error bars are standard error. Significant differences: **p≤0.01. This experiment was independently performed three times with at least one mouse of each genotype in each experimental replicate. D, Representative TCRβ/Vβ10 FACS data from Vβ1NT/NT and Vβ1NT/NTDicer−/− mice. The Vβ10+ cell gate and the percentages of thymocytes within these gates are indicated. E, Graph showing the average percentages of TCRβhigh thymocytes expressing the indicated Vβ segments in Vβ1NT/NT and Vβ1NT/NTDicer−/− mice. Error bars are standard error. Significant differences: ***p≤ 0.001. This experiment was independently performed three times with at least one mouse of each genotype in each experimental replicate. F, Representative TCRβ/Vβ10 FACS data from Vβ1NT/+DicerF/+ and Vβ1NT/+Dicer+/− mice. The Vβ10+ cell gate and the percentage of thymocytes in this gate are indicated. G, Graph showing average percentage of Vβ10+ thymocytes from Vβ1NT/+DicerF/+ and Vβ1NT/+Dicer+/− mice. Error bars are standard error. No significant differences were observed. This experiment was done three independent times on at least one mouse of each genotype. H, Representative PCR analysis of rearrangements involving the indicated Vβ segments to DJβ1.1/DJβ1.2 or DJβ2.1/DJβ2.2 complexes in thymocytes of Vβ1NT/+ and Vβ1NT/+Dicer−/− mice. A Cβ PCR control for genomic DNA content is also shown. This experiment was done three independent times on one mouse of each genotype. I, Representative TCRβ/Vβ10 FACS data from DicerF/F and Dicer−/− mice. The Vβ10+ cell gate and the percentage of thymocytes in this gate are indicated. J, Graph showing average percentages of TCRβhigh thymocytes expressing the indicated Vβ segments in DicerF/F and Dicer−/− mice. Error bars are standard error. No significant differences were detected. This experiment was done three independent times on at least one mouse of each genotype.

