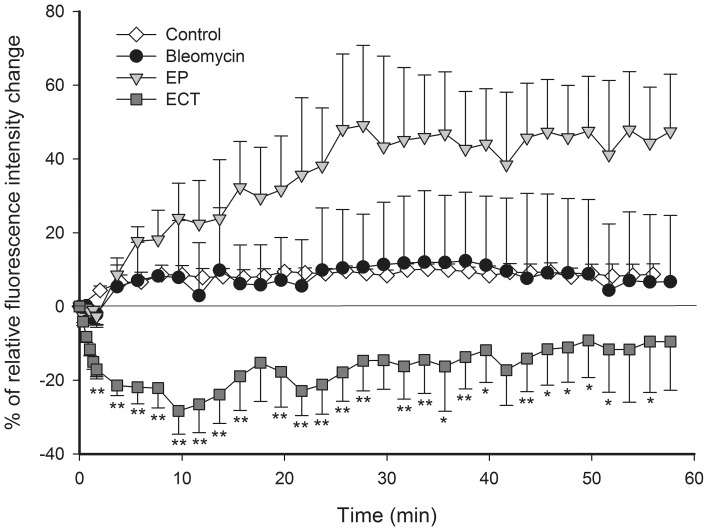
Figure 3. Quantification of FD leakage kinetics from tumor blood vessels.
Relative mean fluorescence intensity changes as a function of time in the tumor tissue, outside the tumor blood vessels. Control – mice without treatment, Bleomycin – mice treated with bleomycin only, EP – mice treated with EP, ECT – mice treated with ECT. n = 3–5. **p<0.05 compared to all other groups, *p<0.05 compared to control and EP groups. Error bars indicate SEM.

