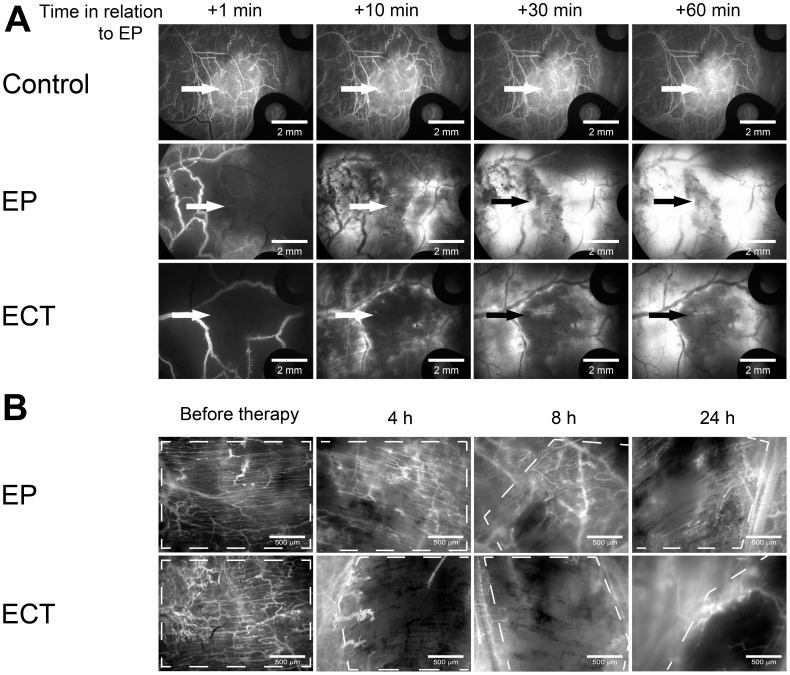
Figure 5. Illustration of a “vascular lock” and re-perfusion of tumor blood vessels in the first hour and 4–24 h after EP and ECT.
Tumor blood vessels were visualized by fluorescence microscopy. Control – mice without treatment, EP – mice treated with EP, ECT – mice treated with ECT. (A) FD was injected i.o. 1 min after EP, and images were acquired at 20×magnification at designated times. Arrows indicate the position of the tumor. Scale bar is 2 mm. (B) RhD was injected i.o. at 4, 8 and 24 h after the therapy, and images were acquired 5 min after the injection at 80×magnification. The images are representative of different tumors. Tumors are marked with a dashed line. Scale bar is 500 µm.

