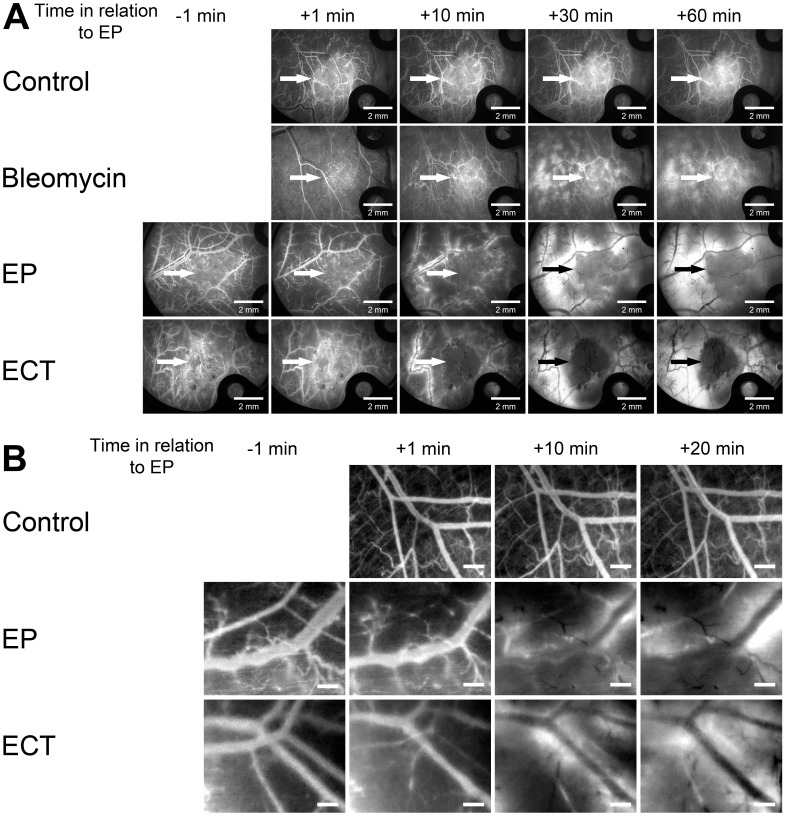
Figure 7. Illustration of FD leakage from blood vessels surrounding the tumor and their constriction after EP and ECT.
Images were acquired at 20×magnification. Control – mice without treatment, Bleomycin – mice treated with bleomycin only, EP – mice treated with EP, ECT – mice treated with ECT. (A) Illustration of FD leakage from blood vessels surrounding the tumor, when FD was injected i.o. before the therapy. Arrows indicate the position of the tumor. Scale bar is 2 mm. (B) Illustration of the constriction of blood vessels surrounding the tumor visualized by FD. The enlarged sections of images were taken at 20×magnification. Scale bar is 500 µm.

