
Figure 7.
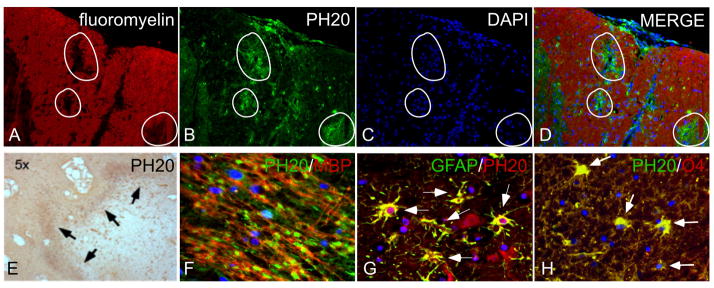
PH20 expression in demyelinated lesions. (A–D) Sections of lumbar spinal cord from mice with EAE, 21 days post-inoculation with MOG. PH20 immunoreactivity (green; B, D) was elevated in areas where there was demyelination (indicated by white circles), identified by loss of fluoromyelin (red) staining (A, D) and increased DAPI labeling (C, D). Merged image is shown in D. (E–H) PH20 is also expressed by glial cells at the borders of chronic, cortical MS patient lesions. PH20 immunoreactivity was enriched at the borders of lesions (arrows, E). Numerous cells expressed PH20 in the lesion borders (F; MBP, red; PH20, green). (G) Double-labeling of MS patient lesion with antibodies against PH20 (red) and GFAP (green). (H) Double-labeling of MS patient lesions with PH20 (green) and O4 (red). Images in A–E are 5x; images in F–H are 40x. Sections were counterstained with DAPI (blue) to label cell nuclei.